Grafana
Links
-
Link to Prometheus.
Overview
- Managing Permissions in Grafana.
- Managing Grafana from Apex.
- Deploying Prometheus.
- Importing Grafana Dashboards.
Managing Permissions in Grafana
-
By default all the Dashboards in Grafana are Public.
-
To provide edit permissions follow below.
-
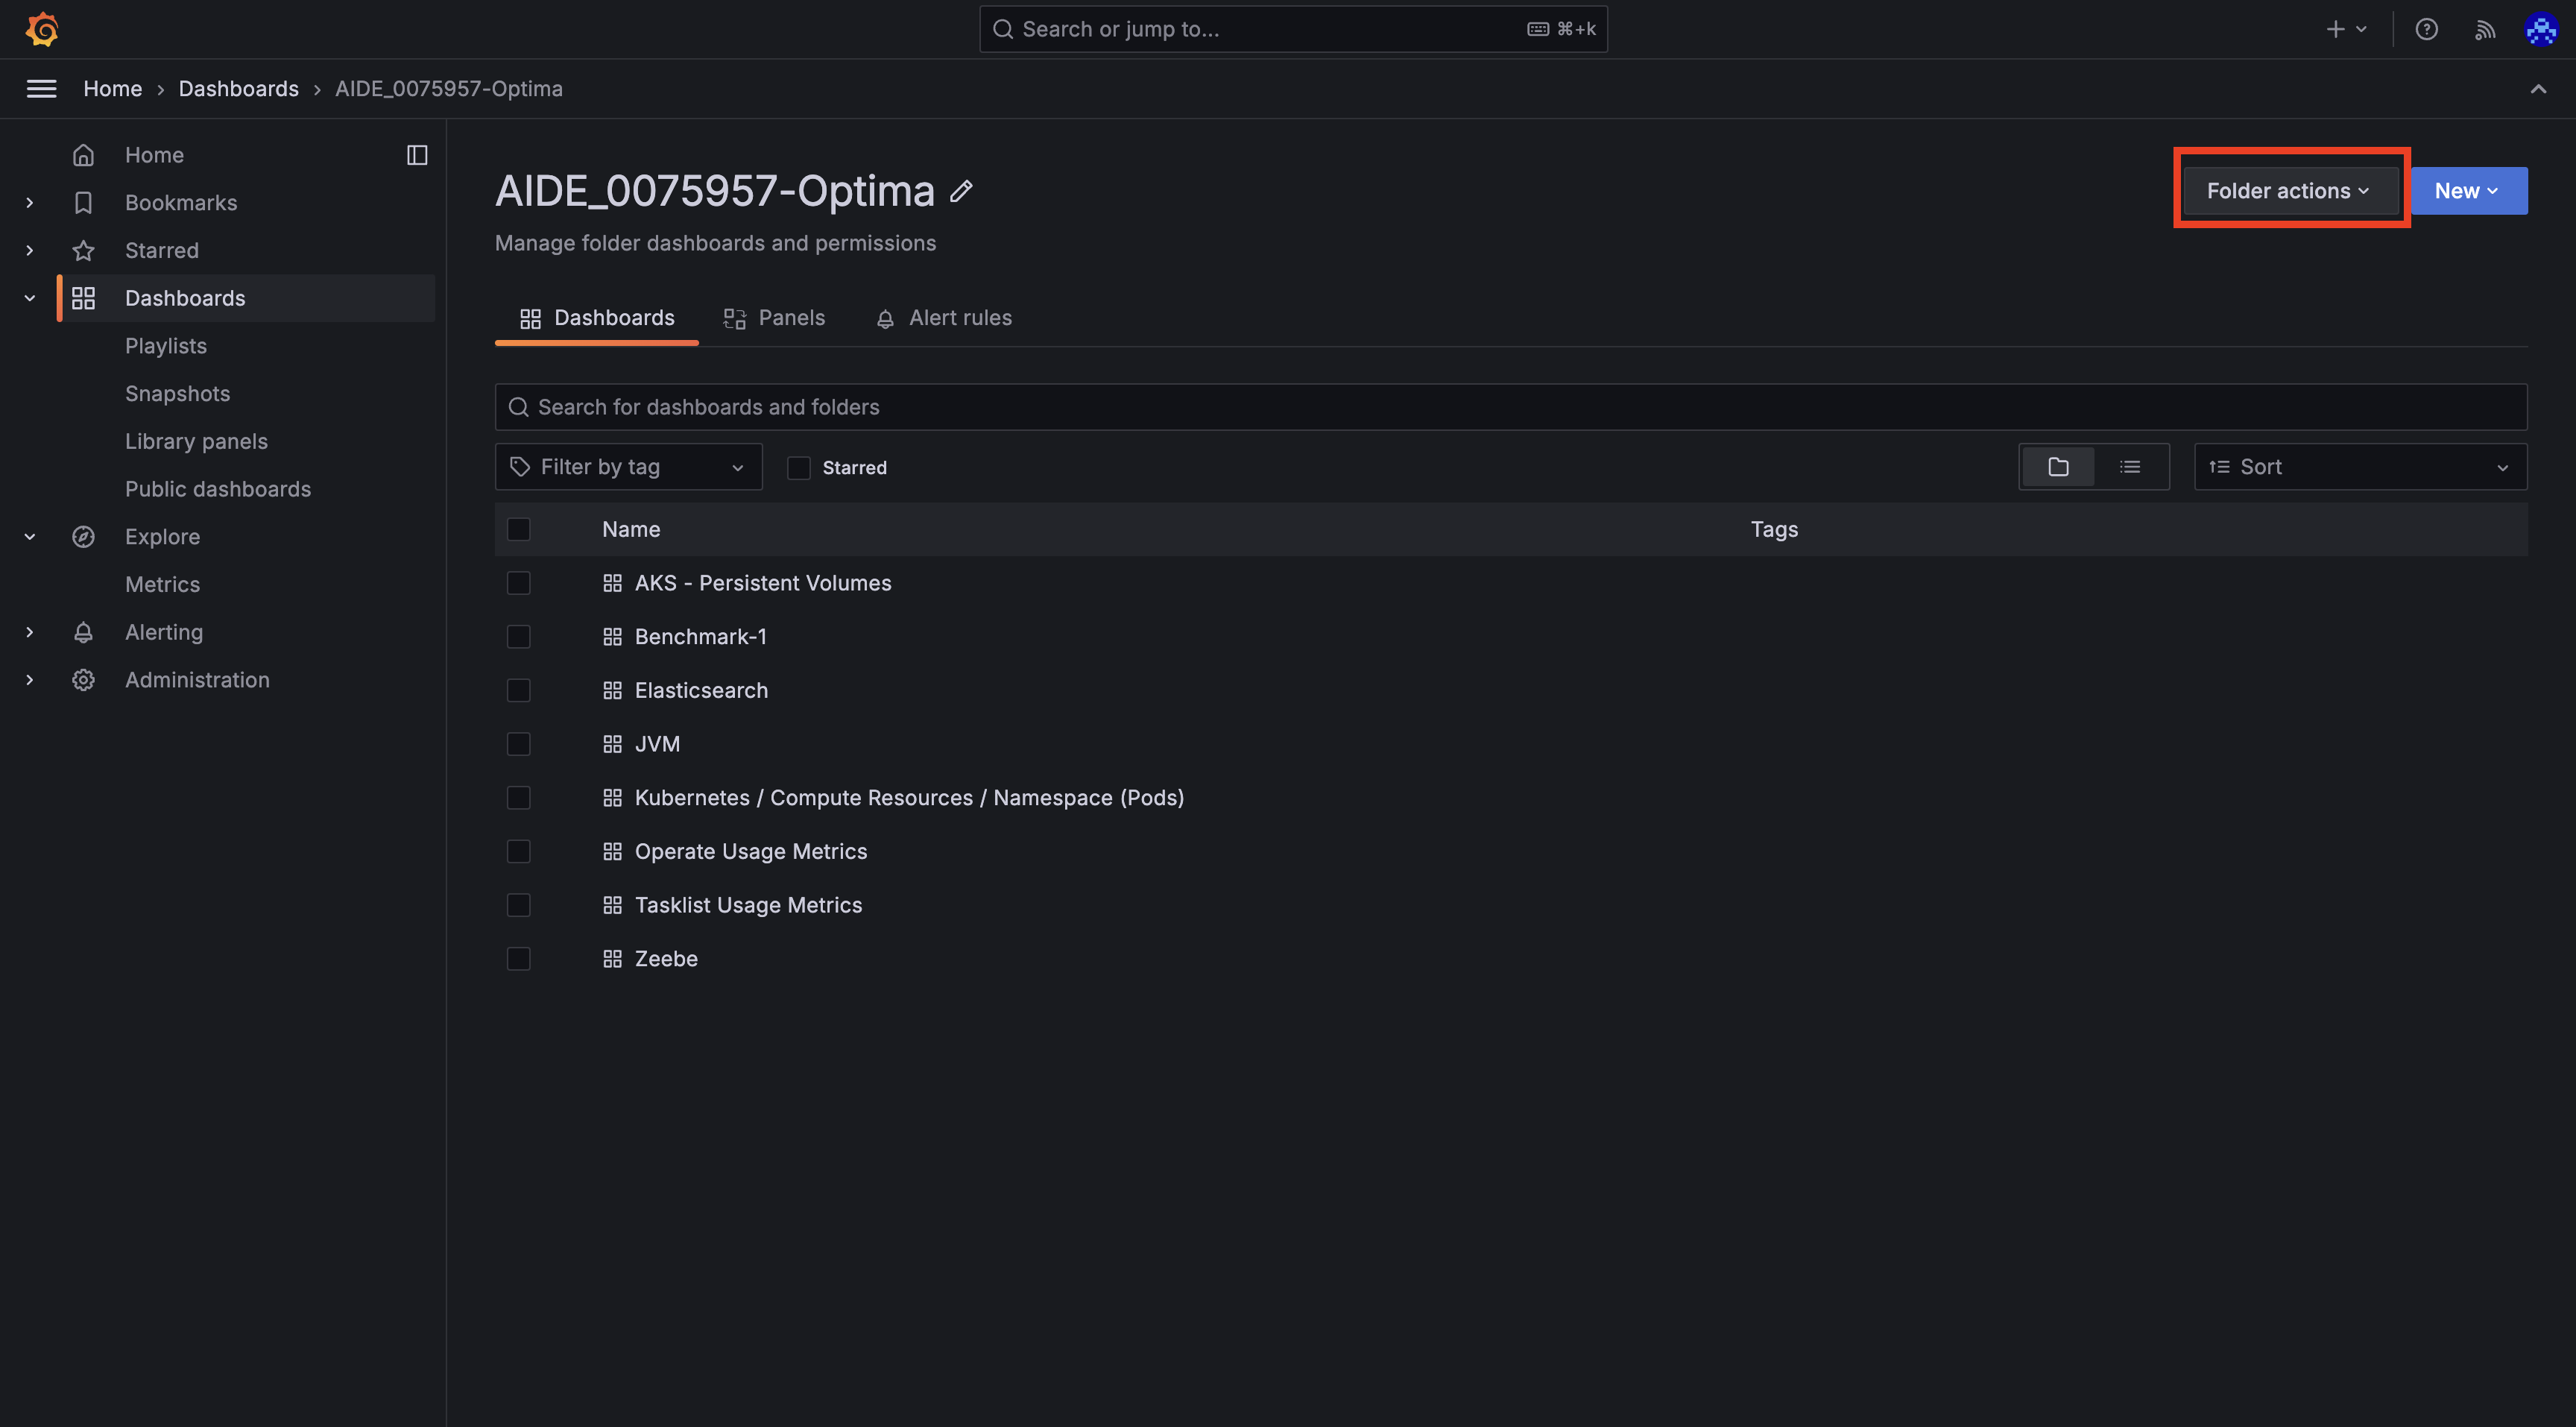
Go to the Dashboard for which permission need to be changes. And Click on Folder Actions.
-
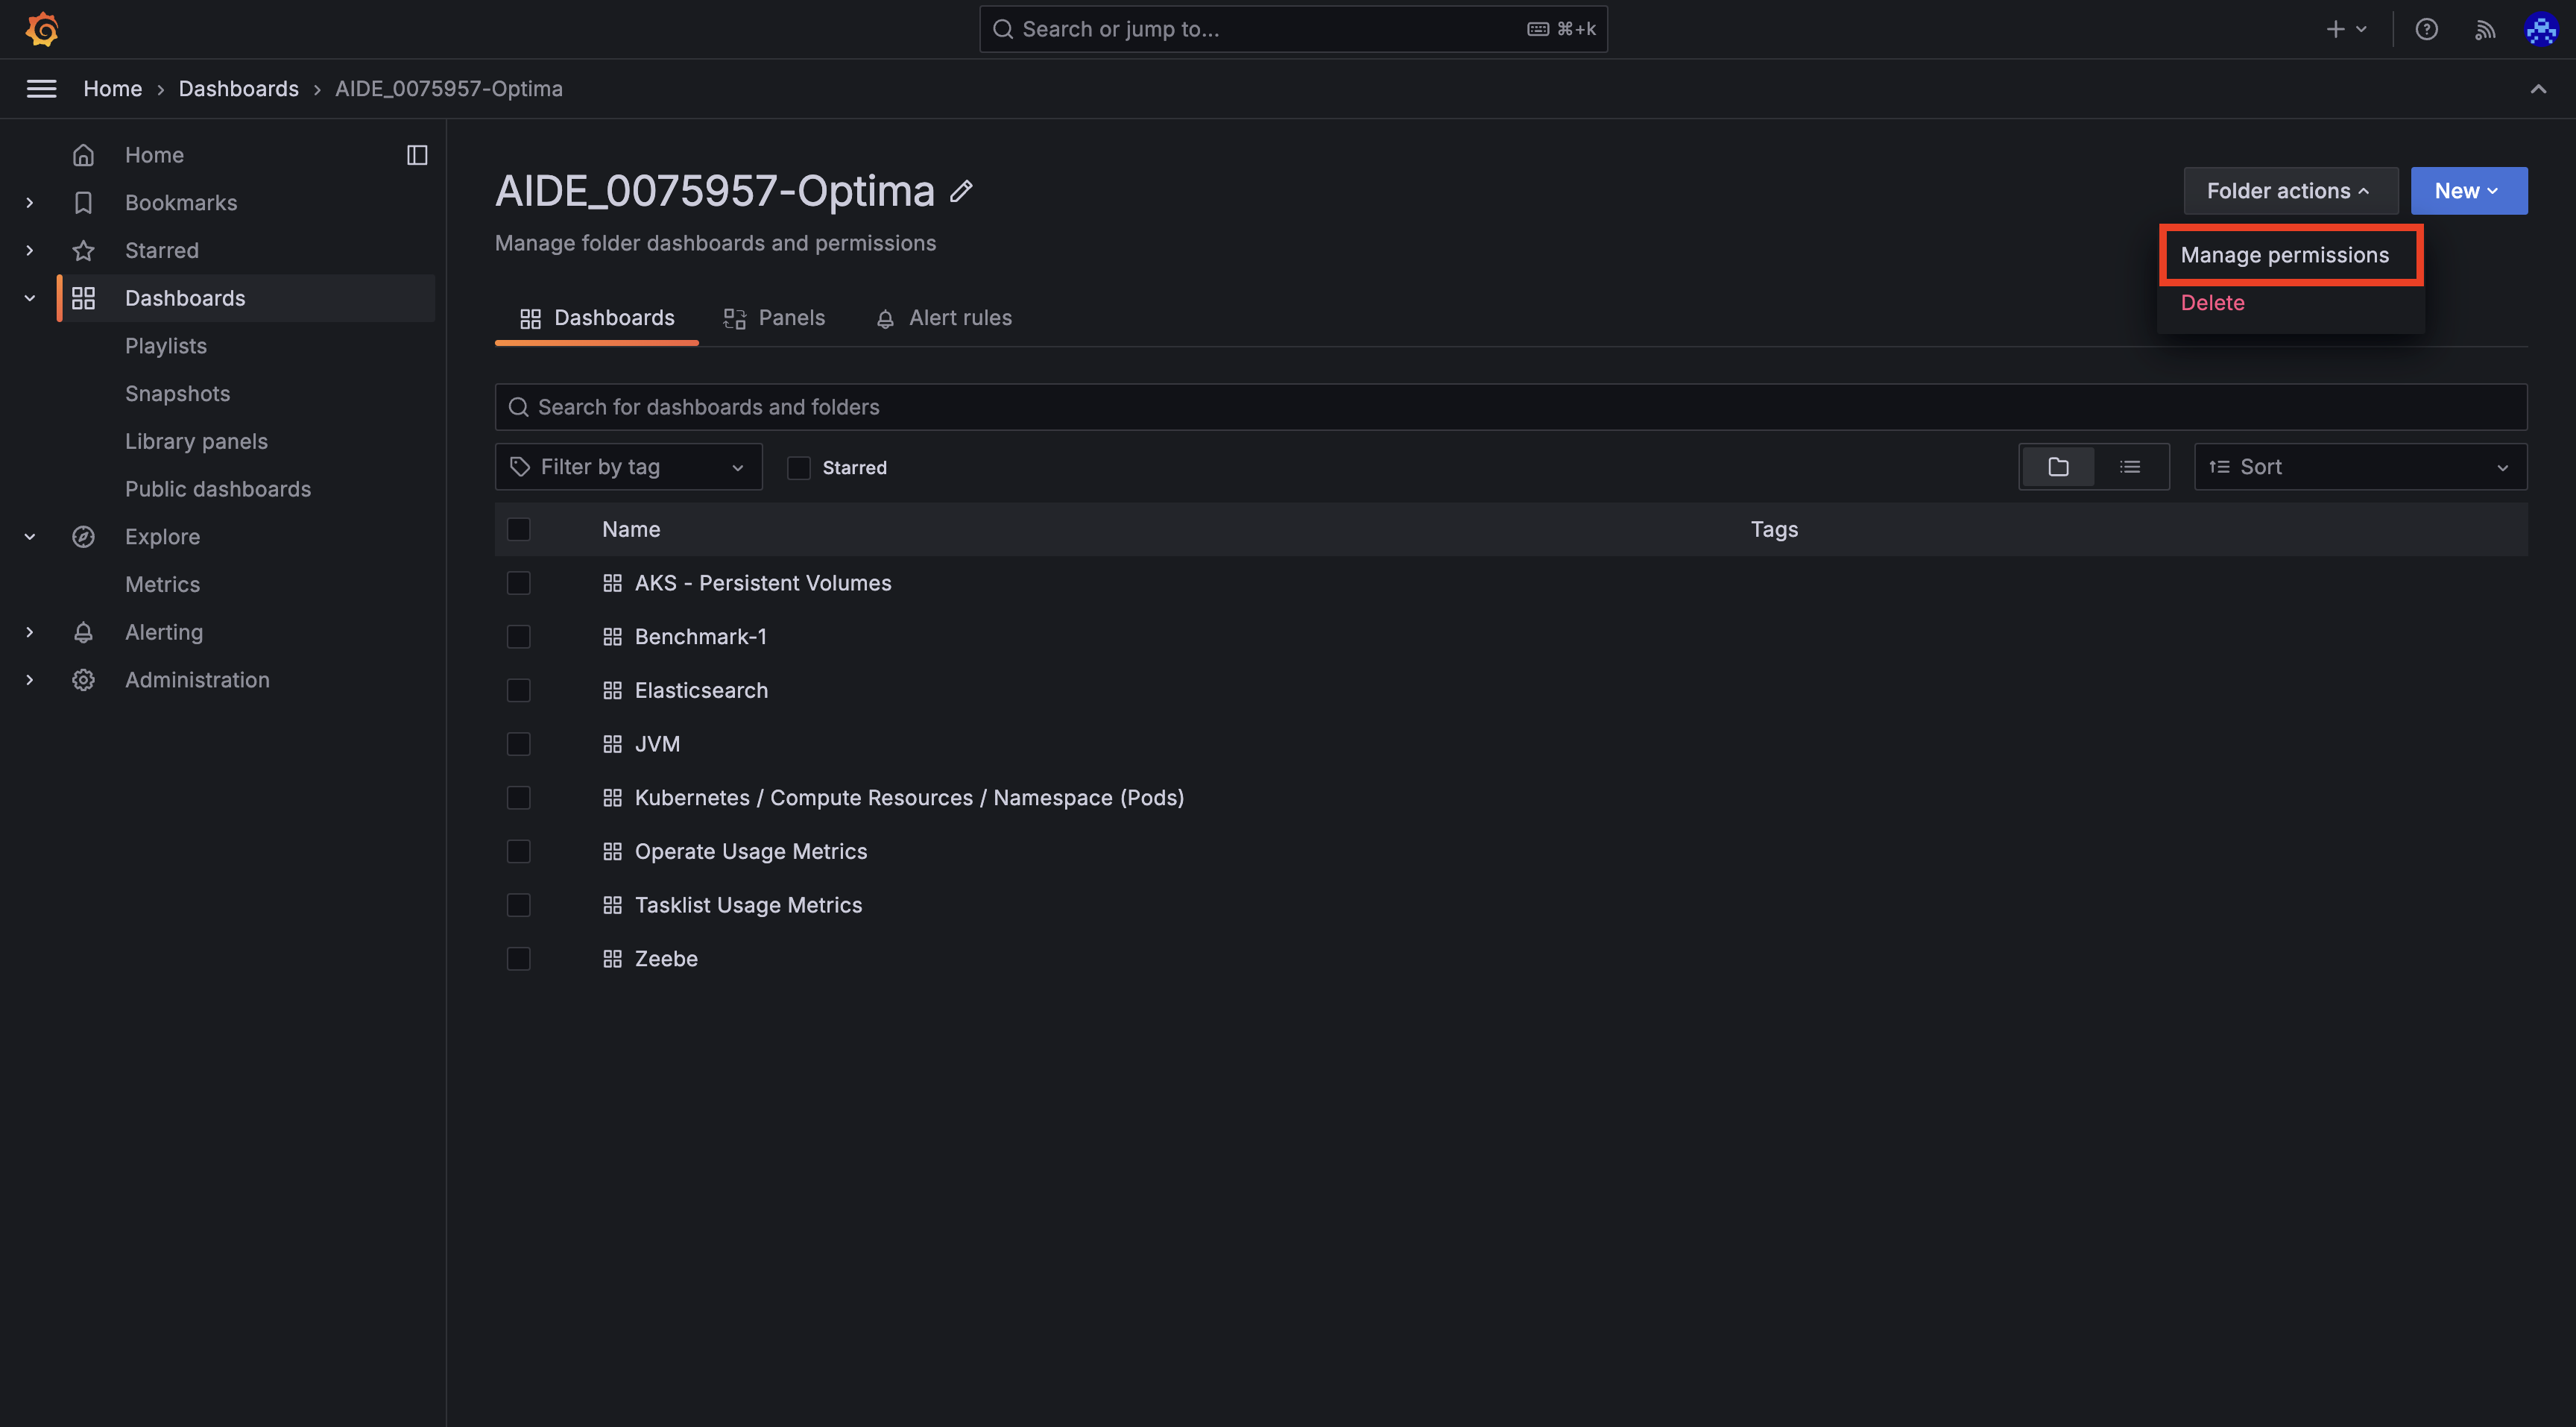
Click on Manage Permissions.
-
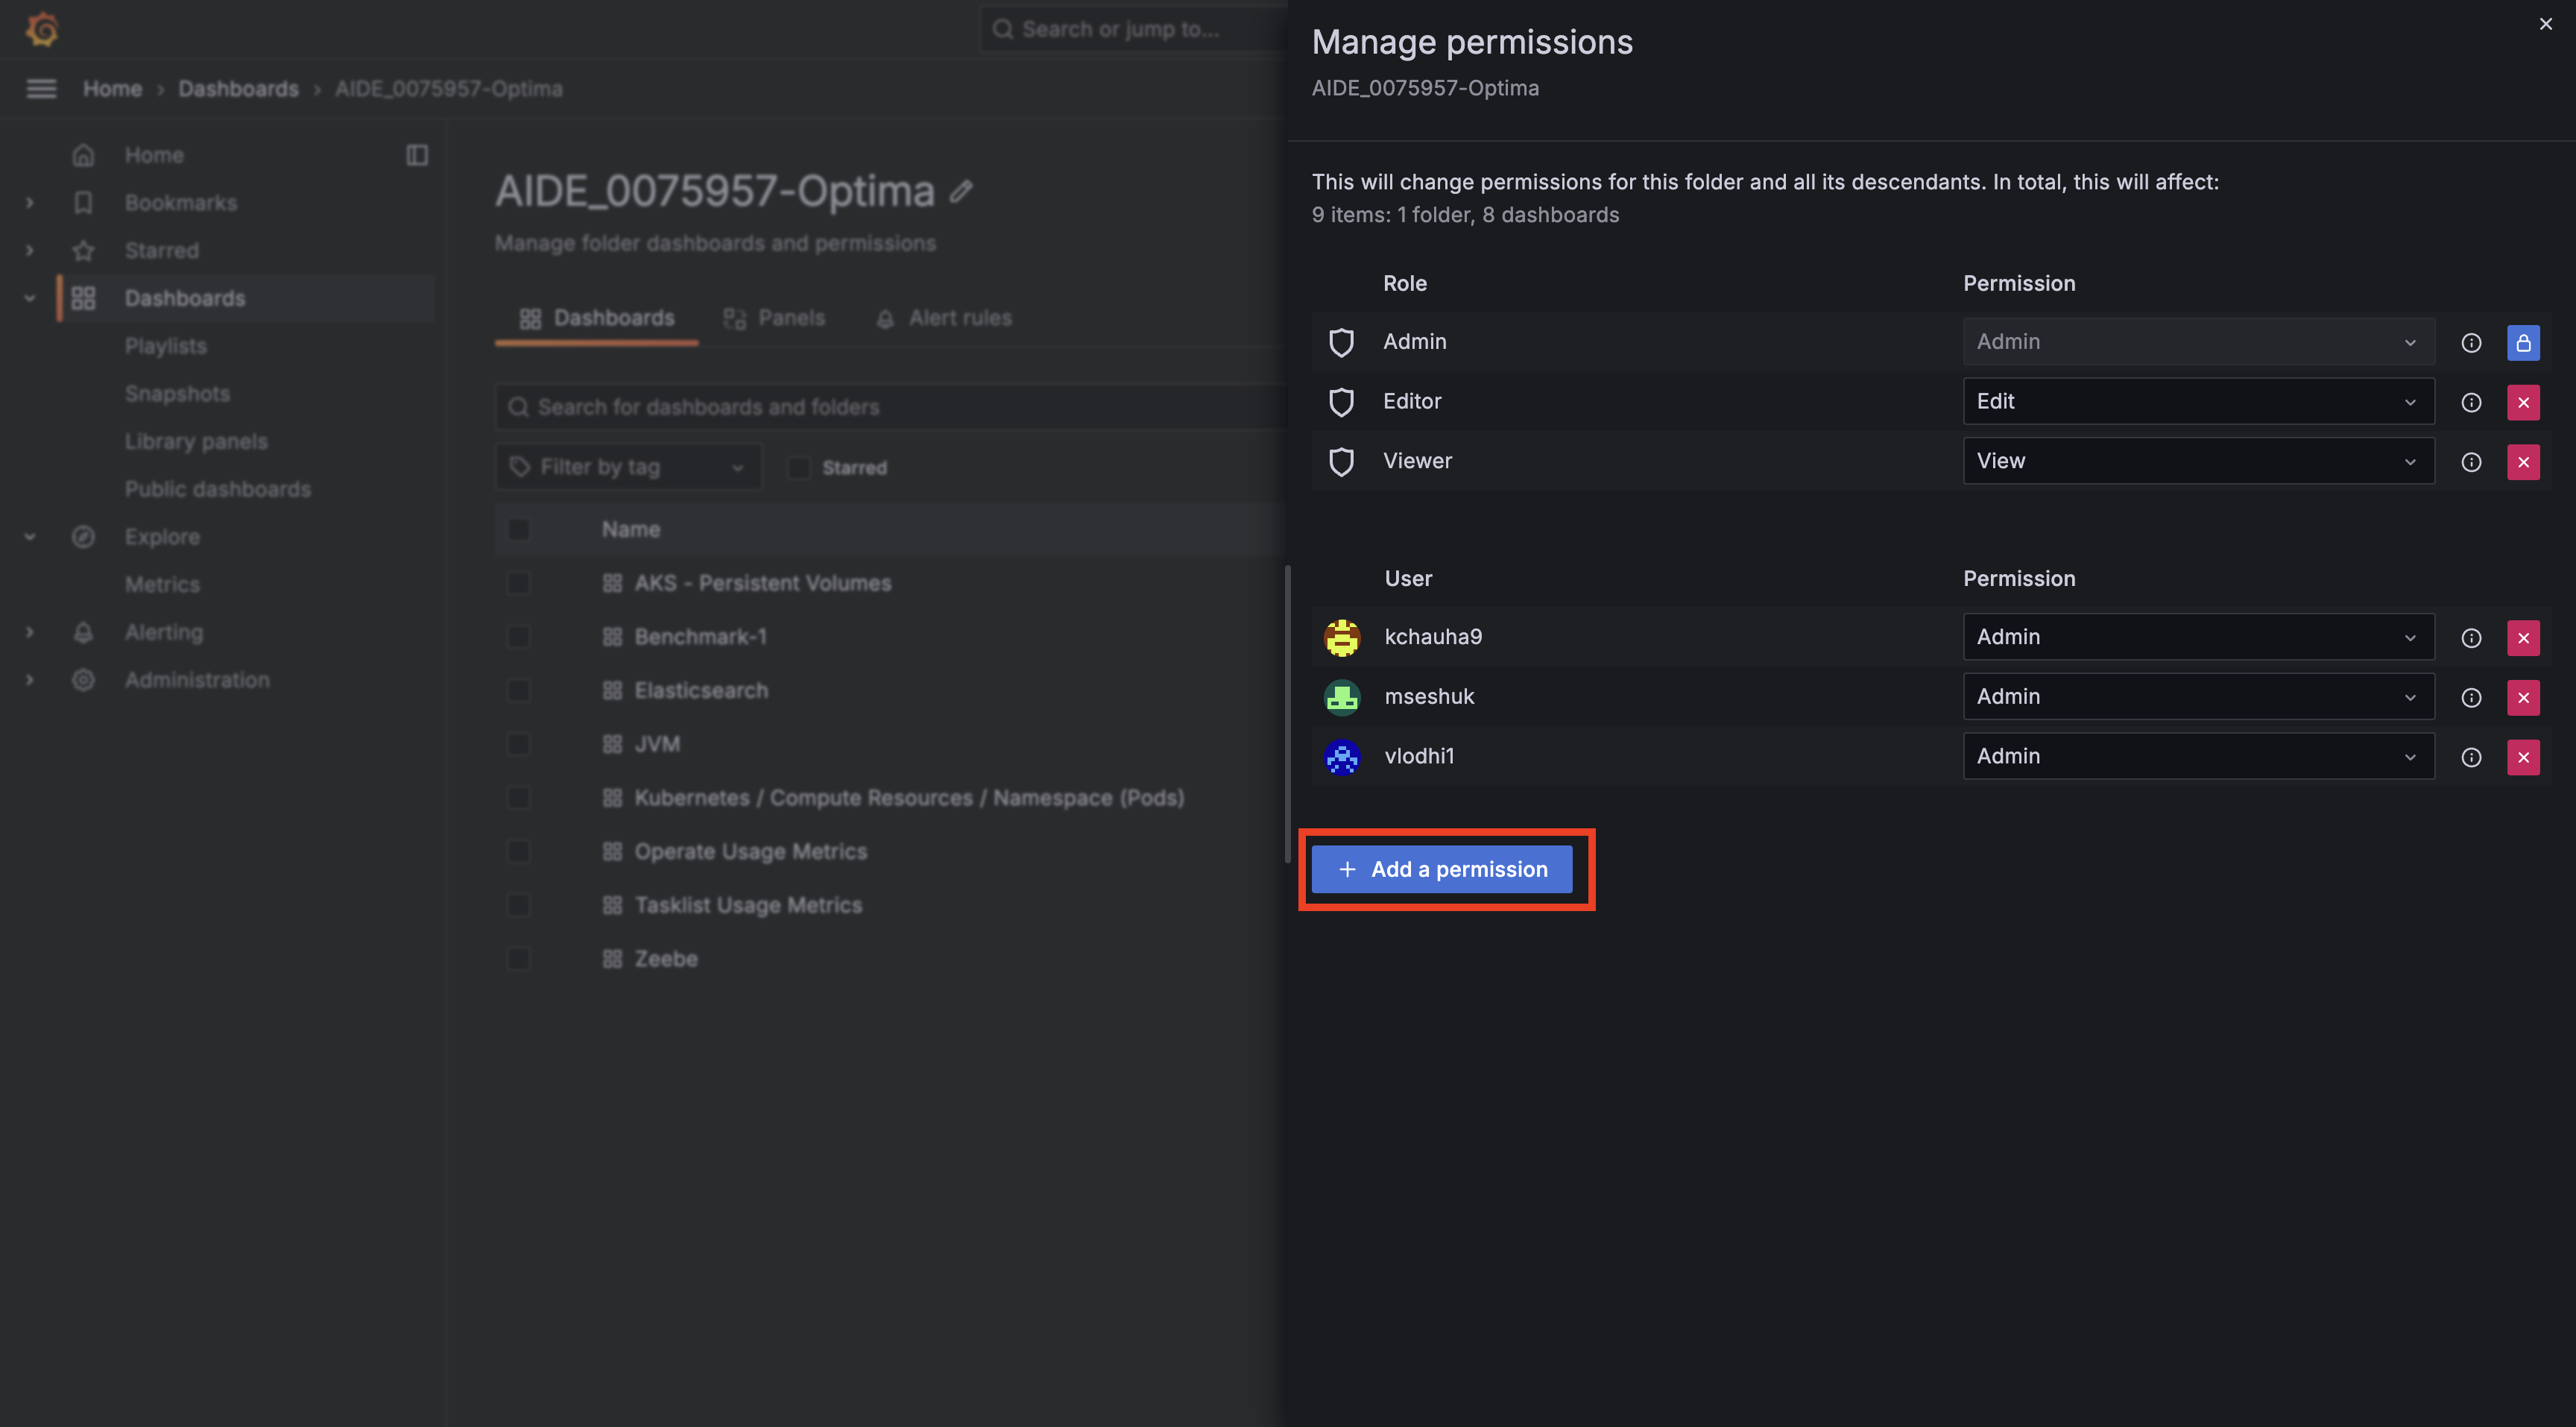
Click on Add Permissions.
-
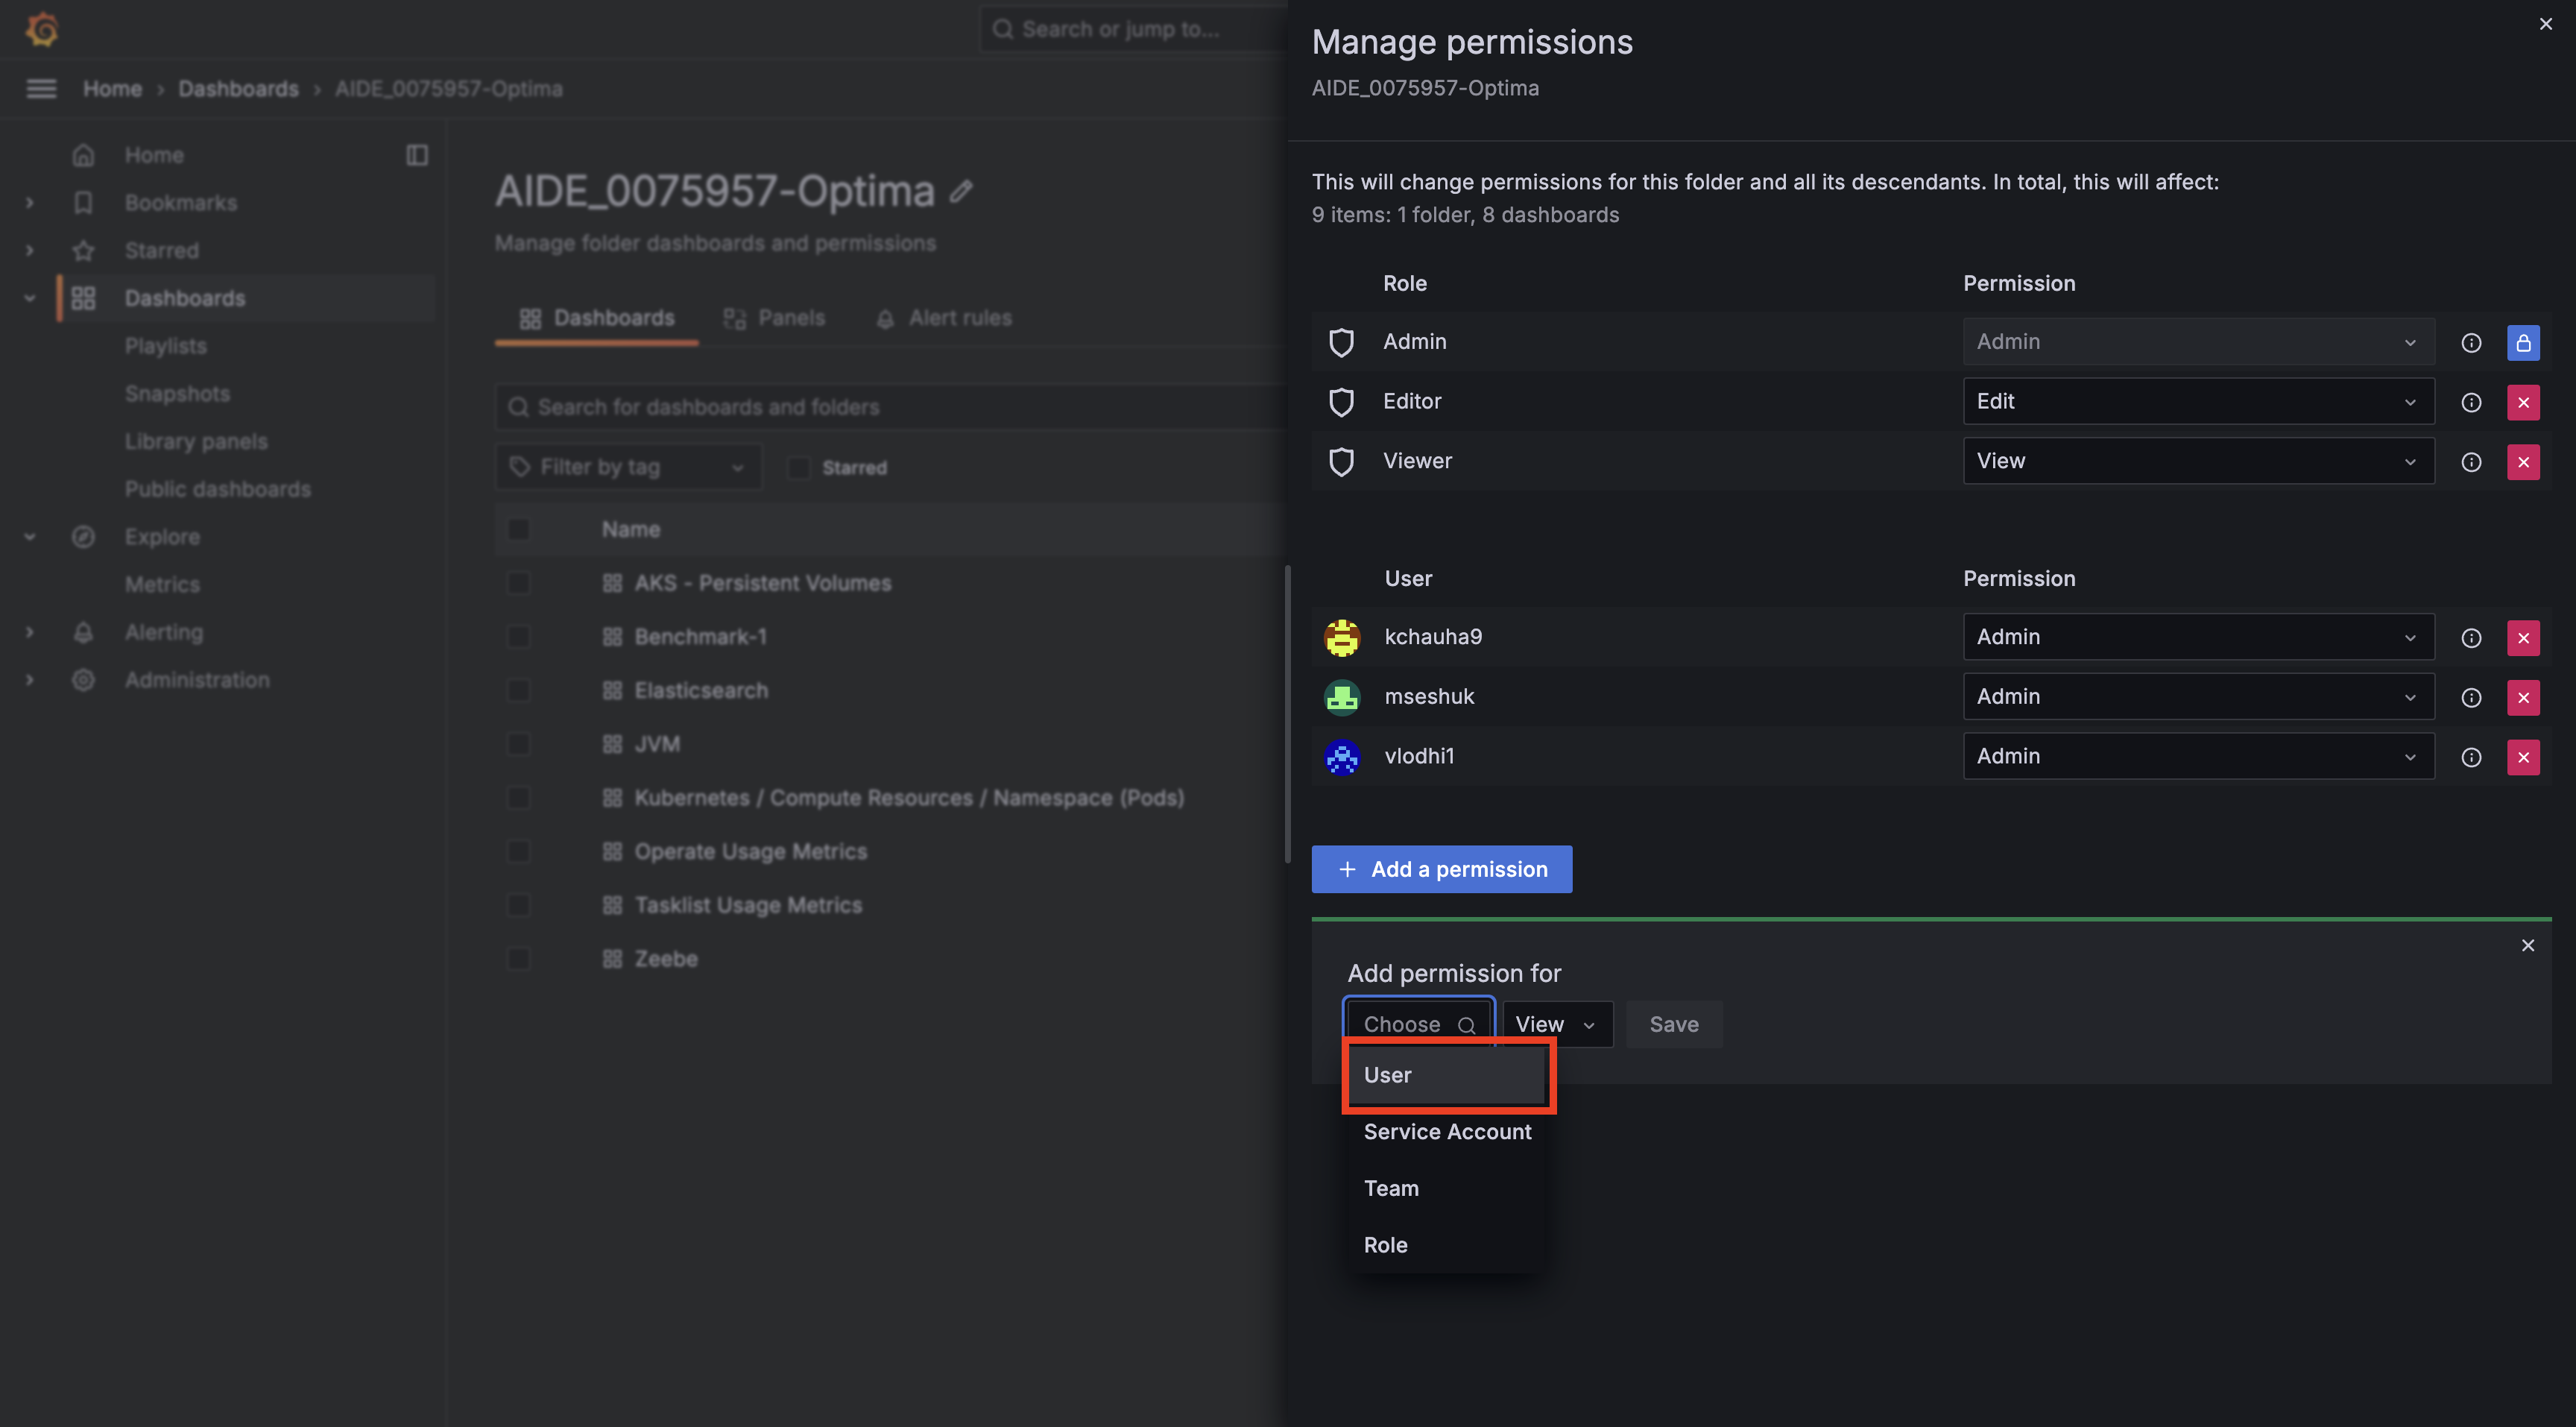
Select User from Drop Down and search with the User's MSID.
-
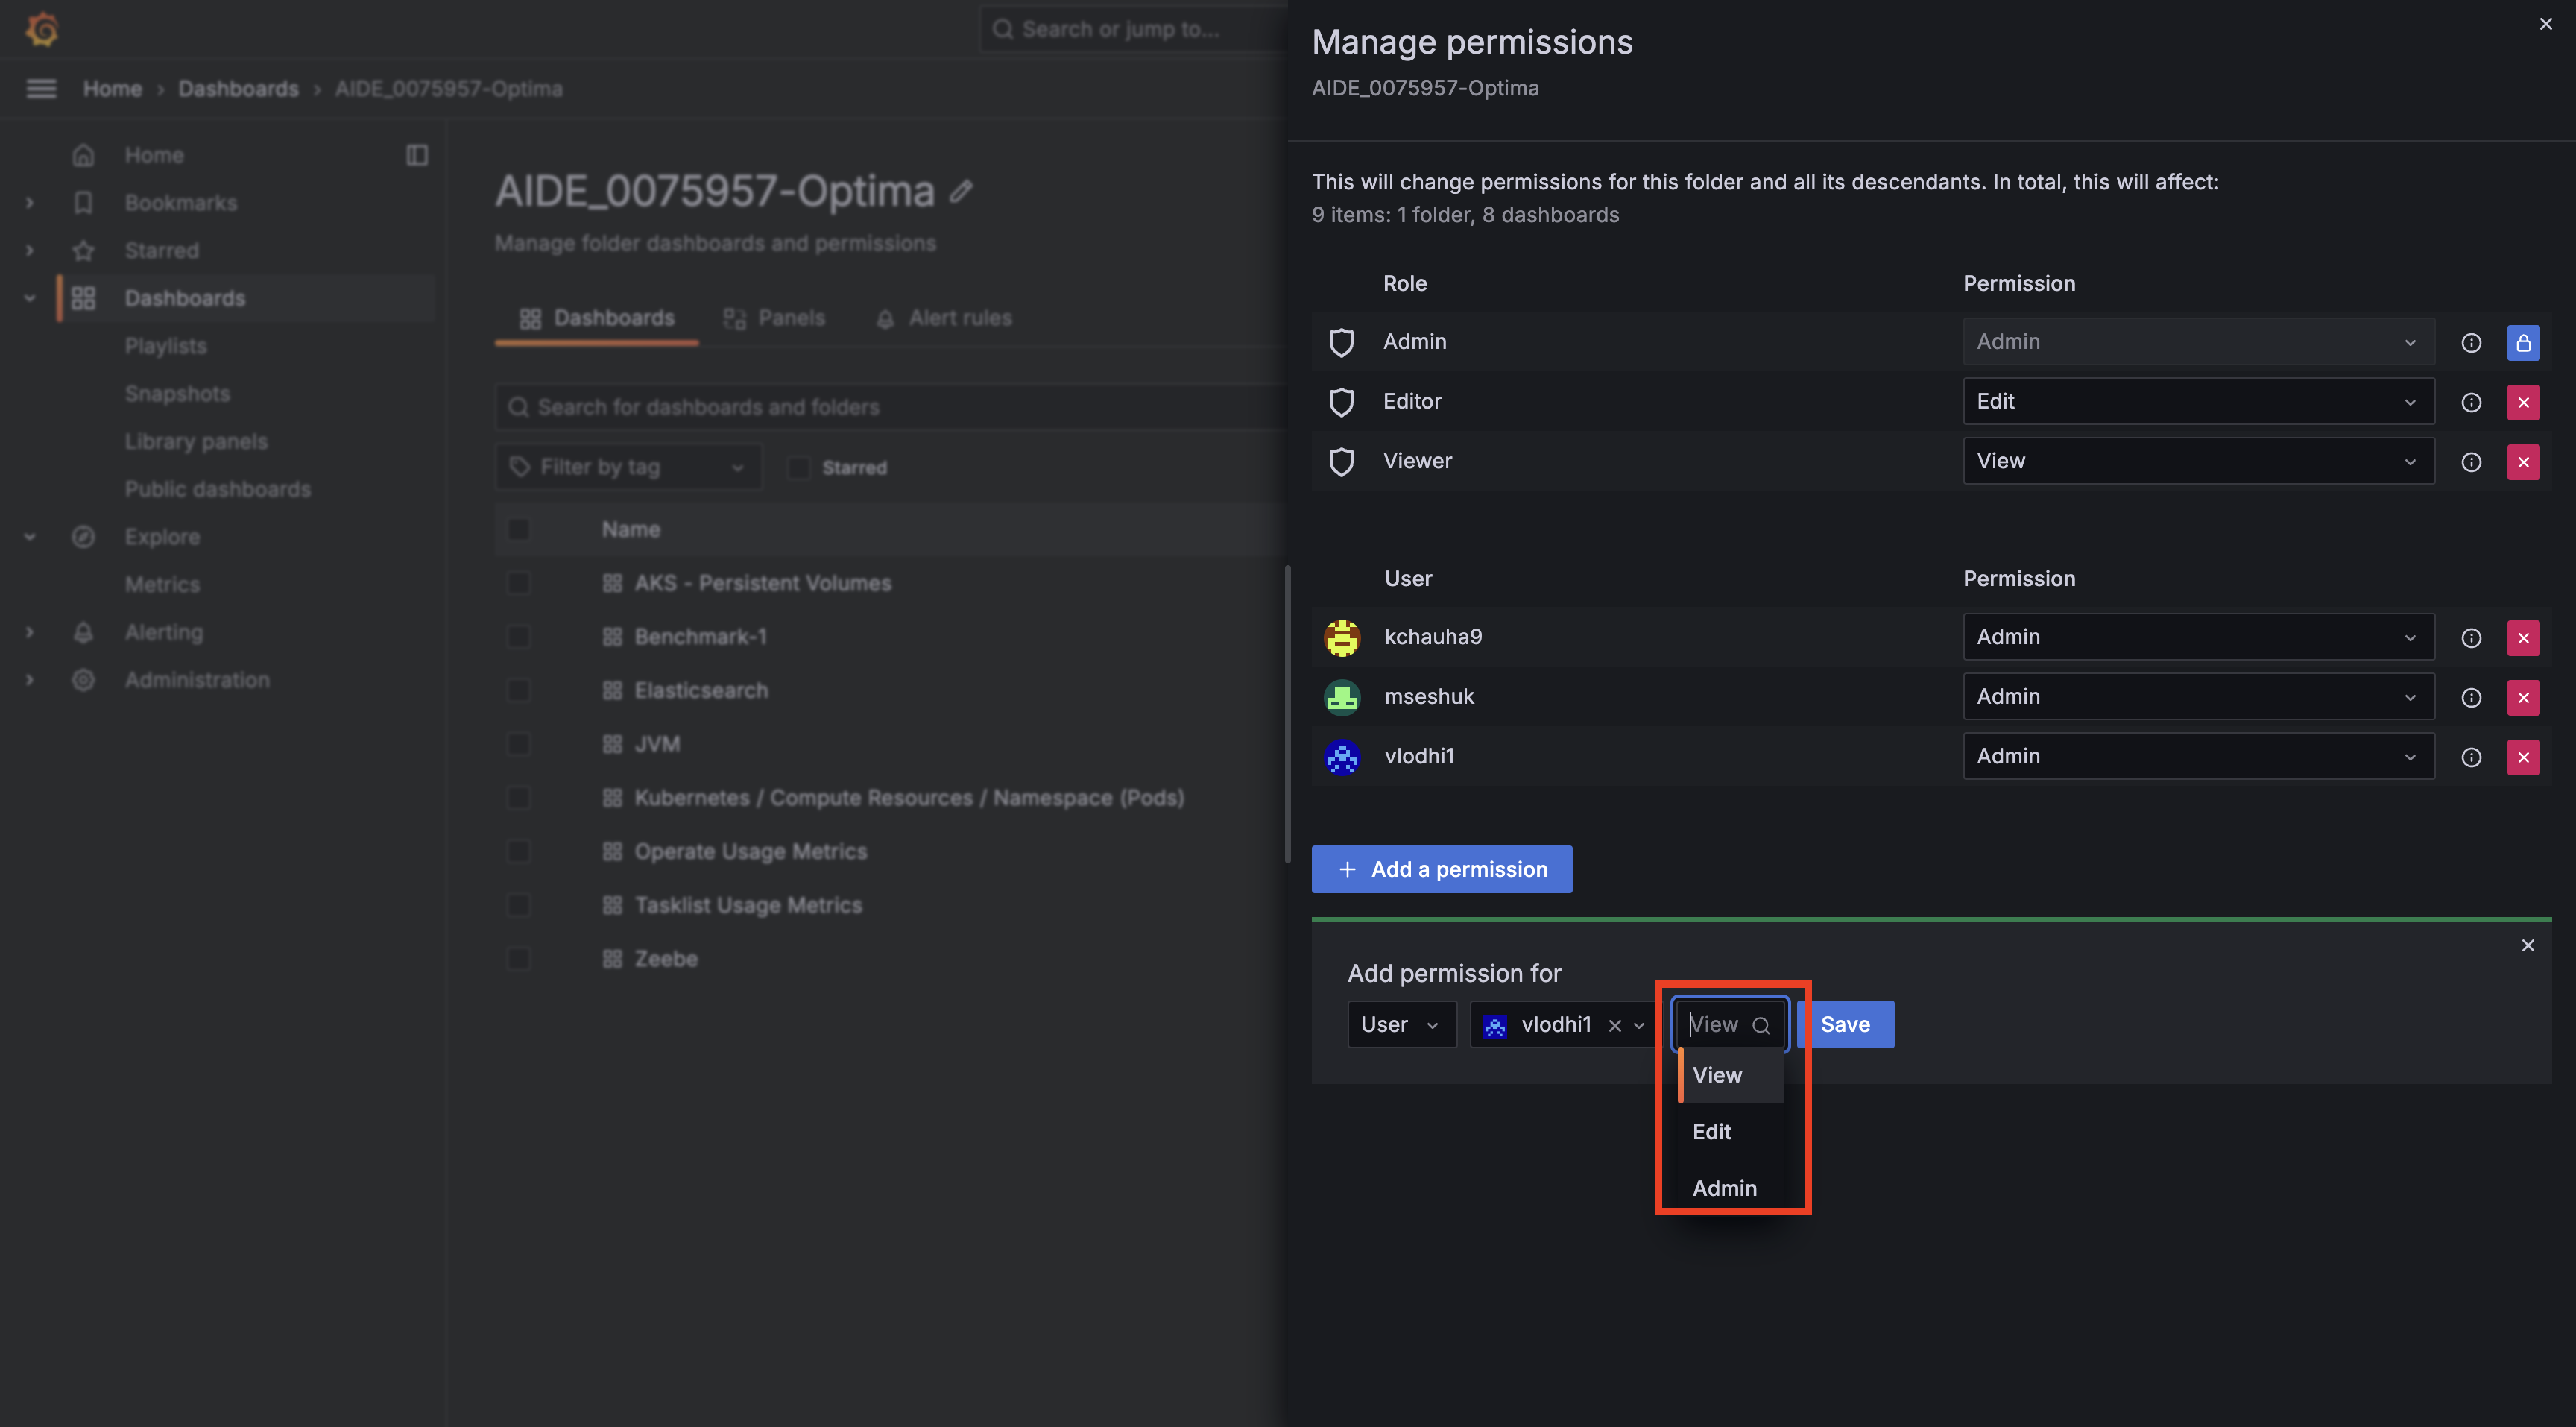
Select any one of the permissions.
-
Click Save.
-
Managing Grafana from Apex
Requesting Folder
Steps
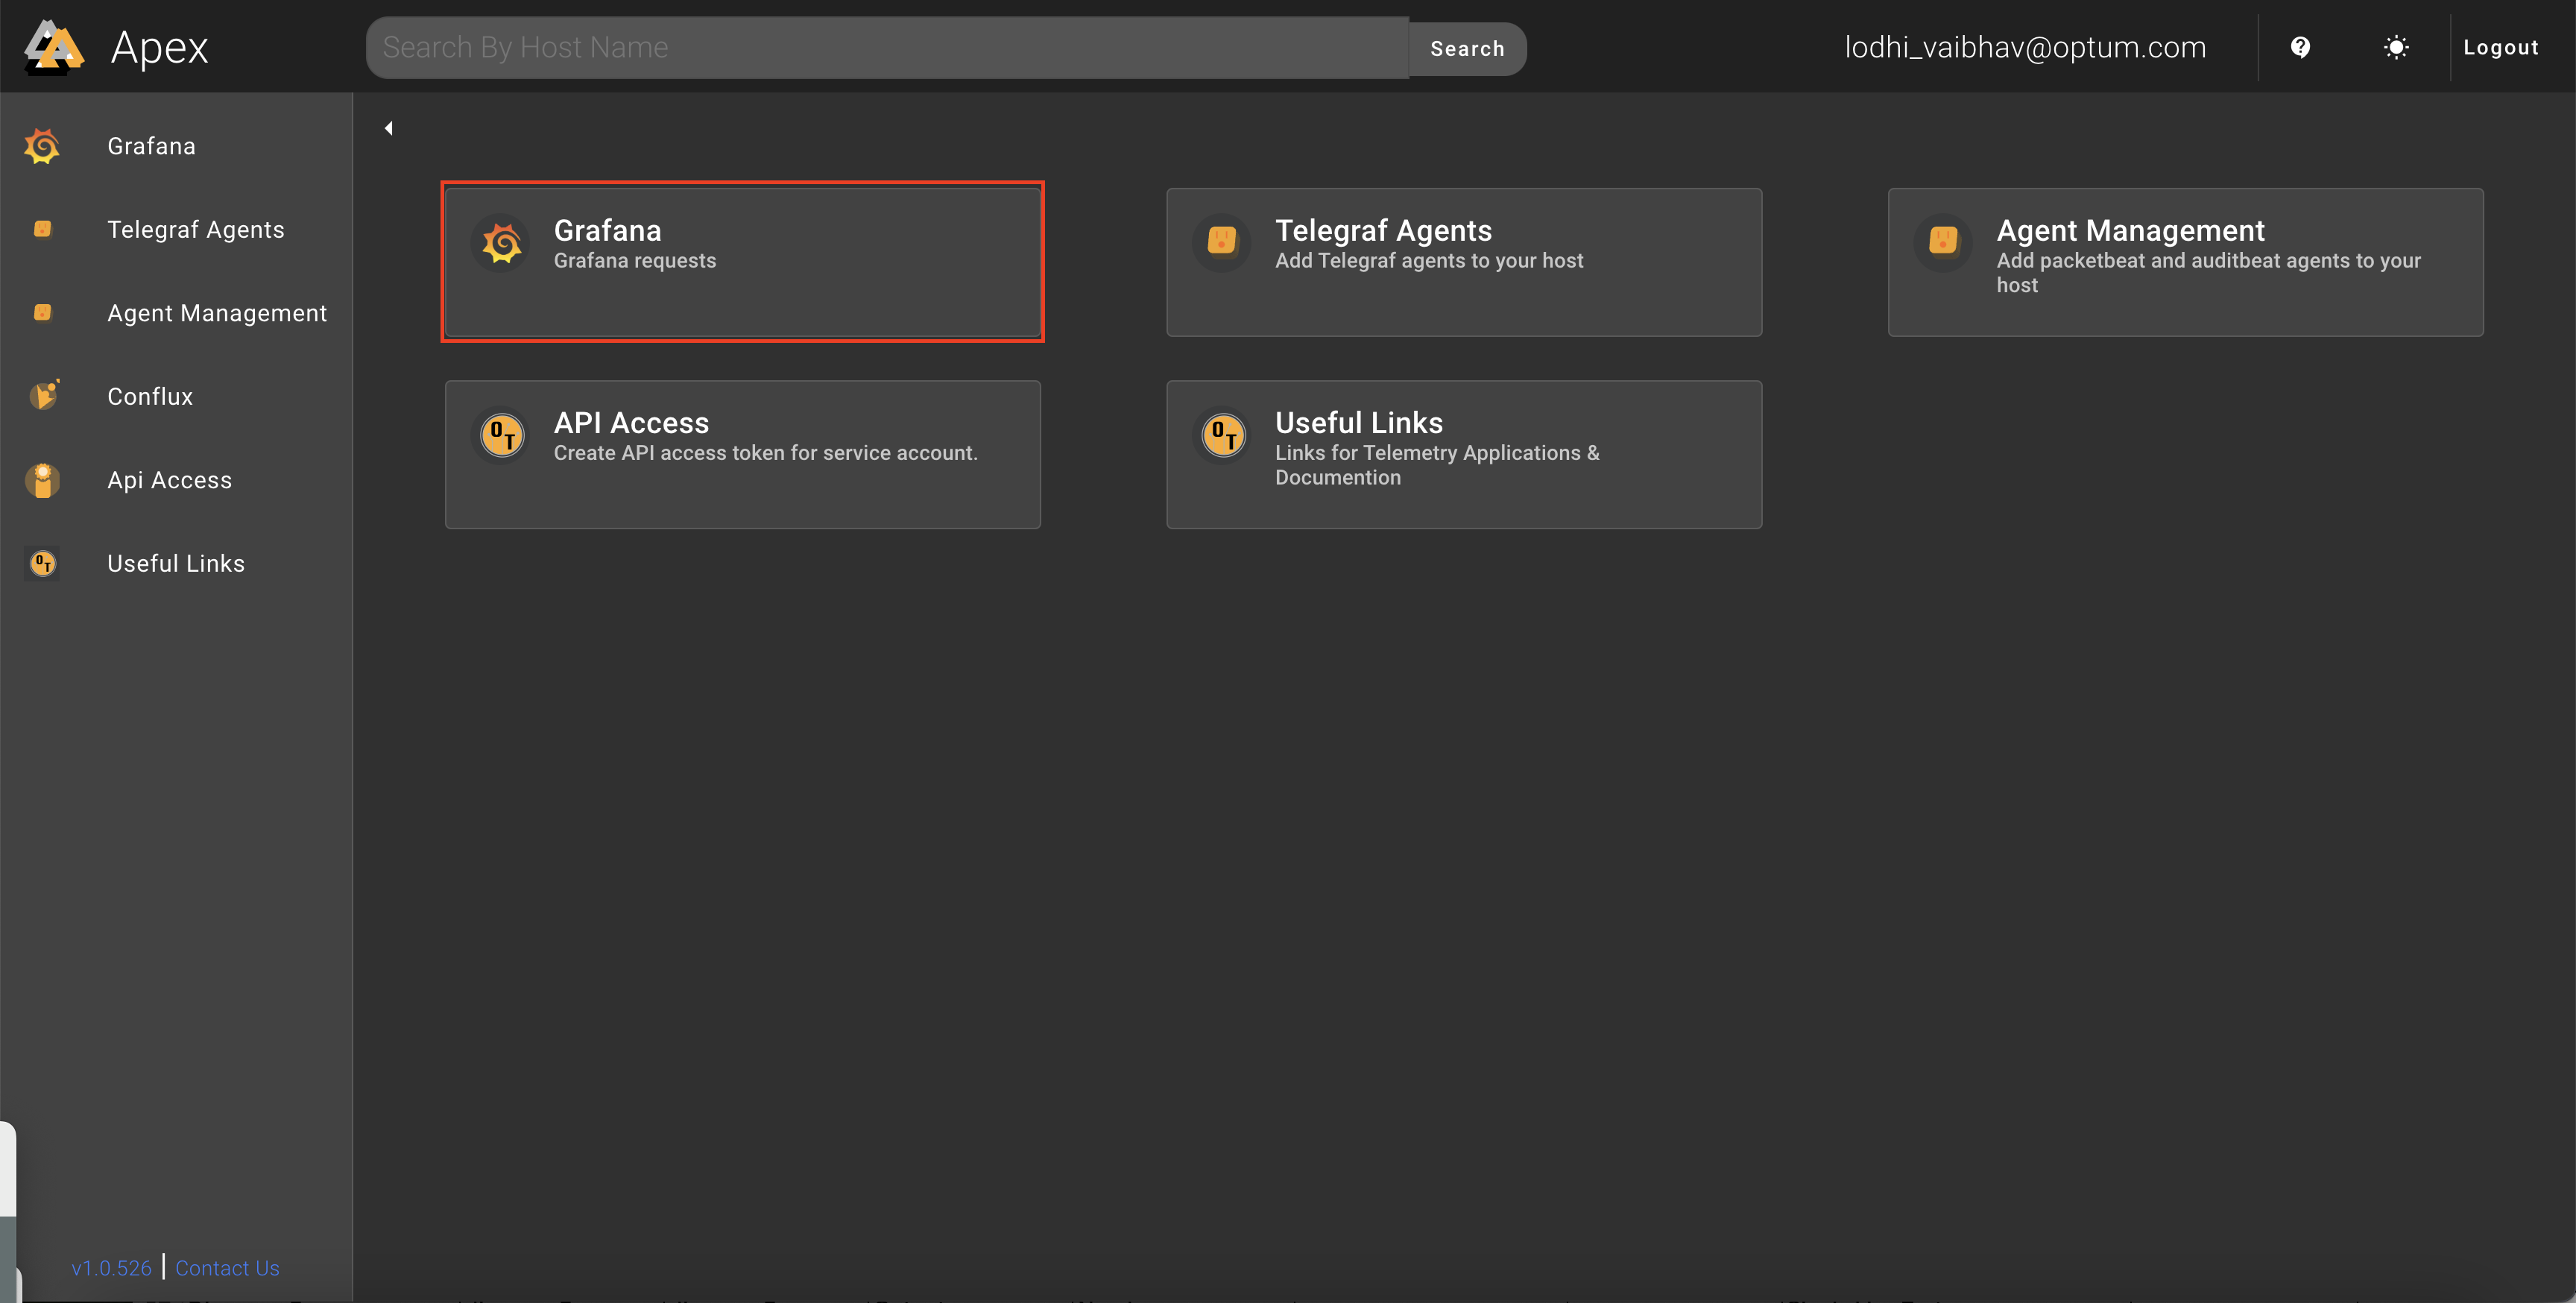
- Go to Apex.
- Click on Grafana.
- Click on Folders And Alert Notifications and then Create.
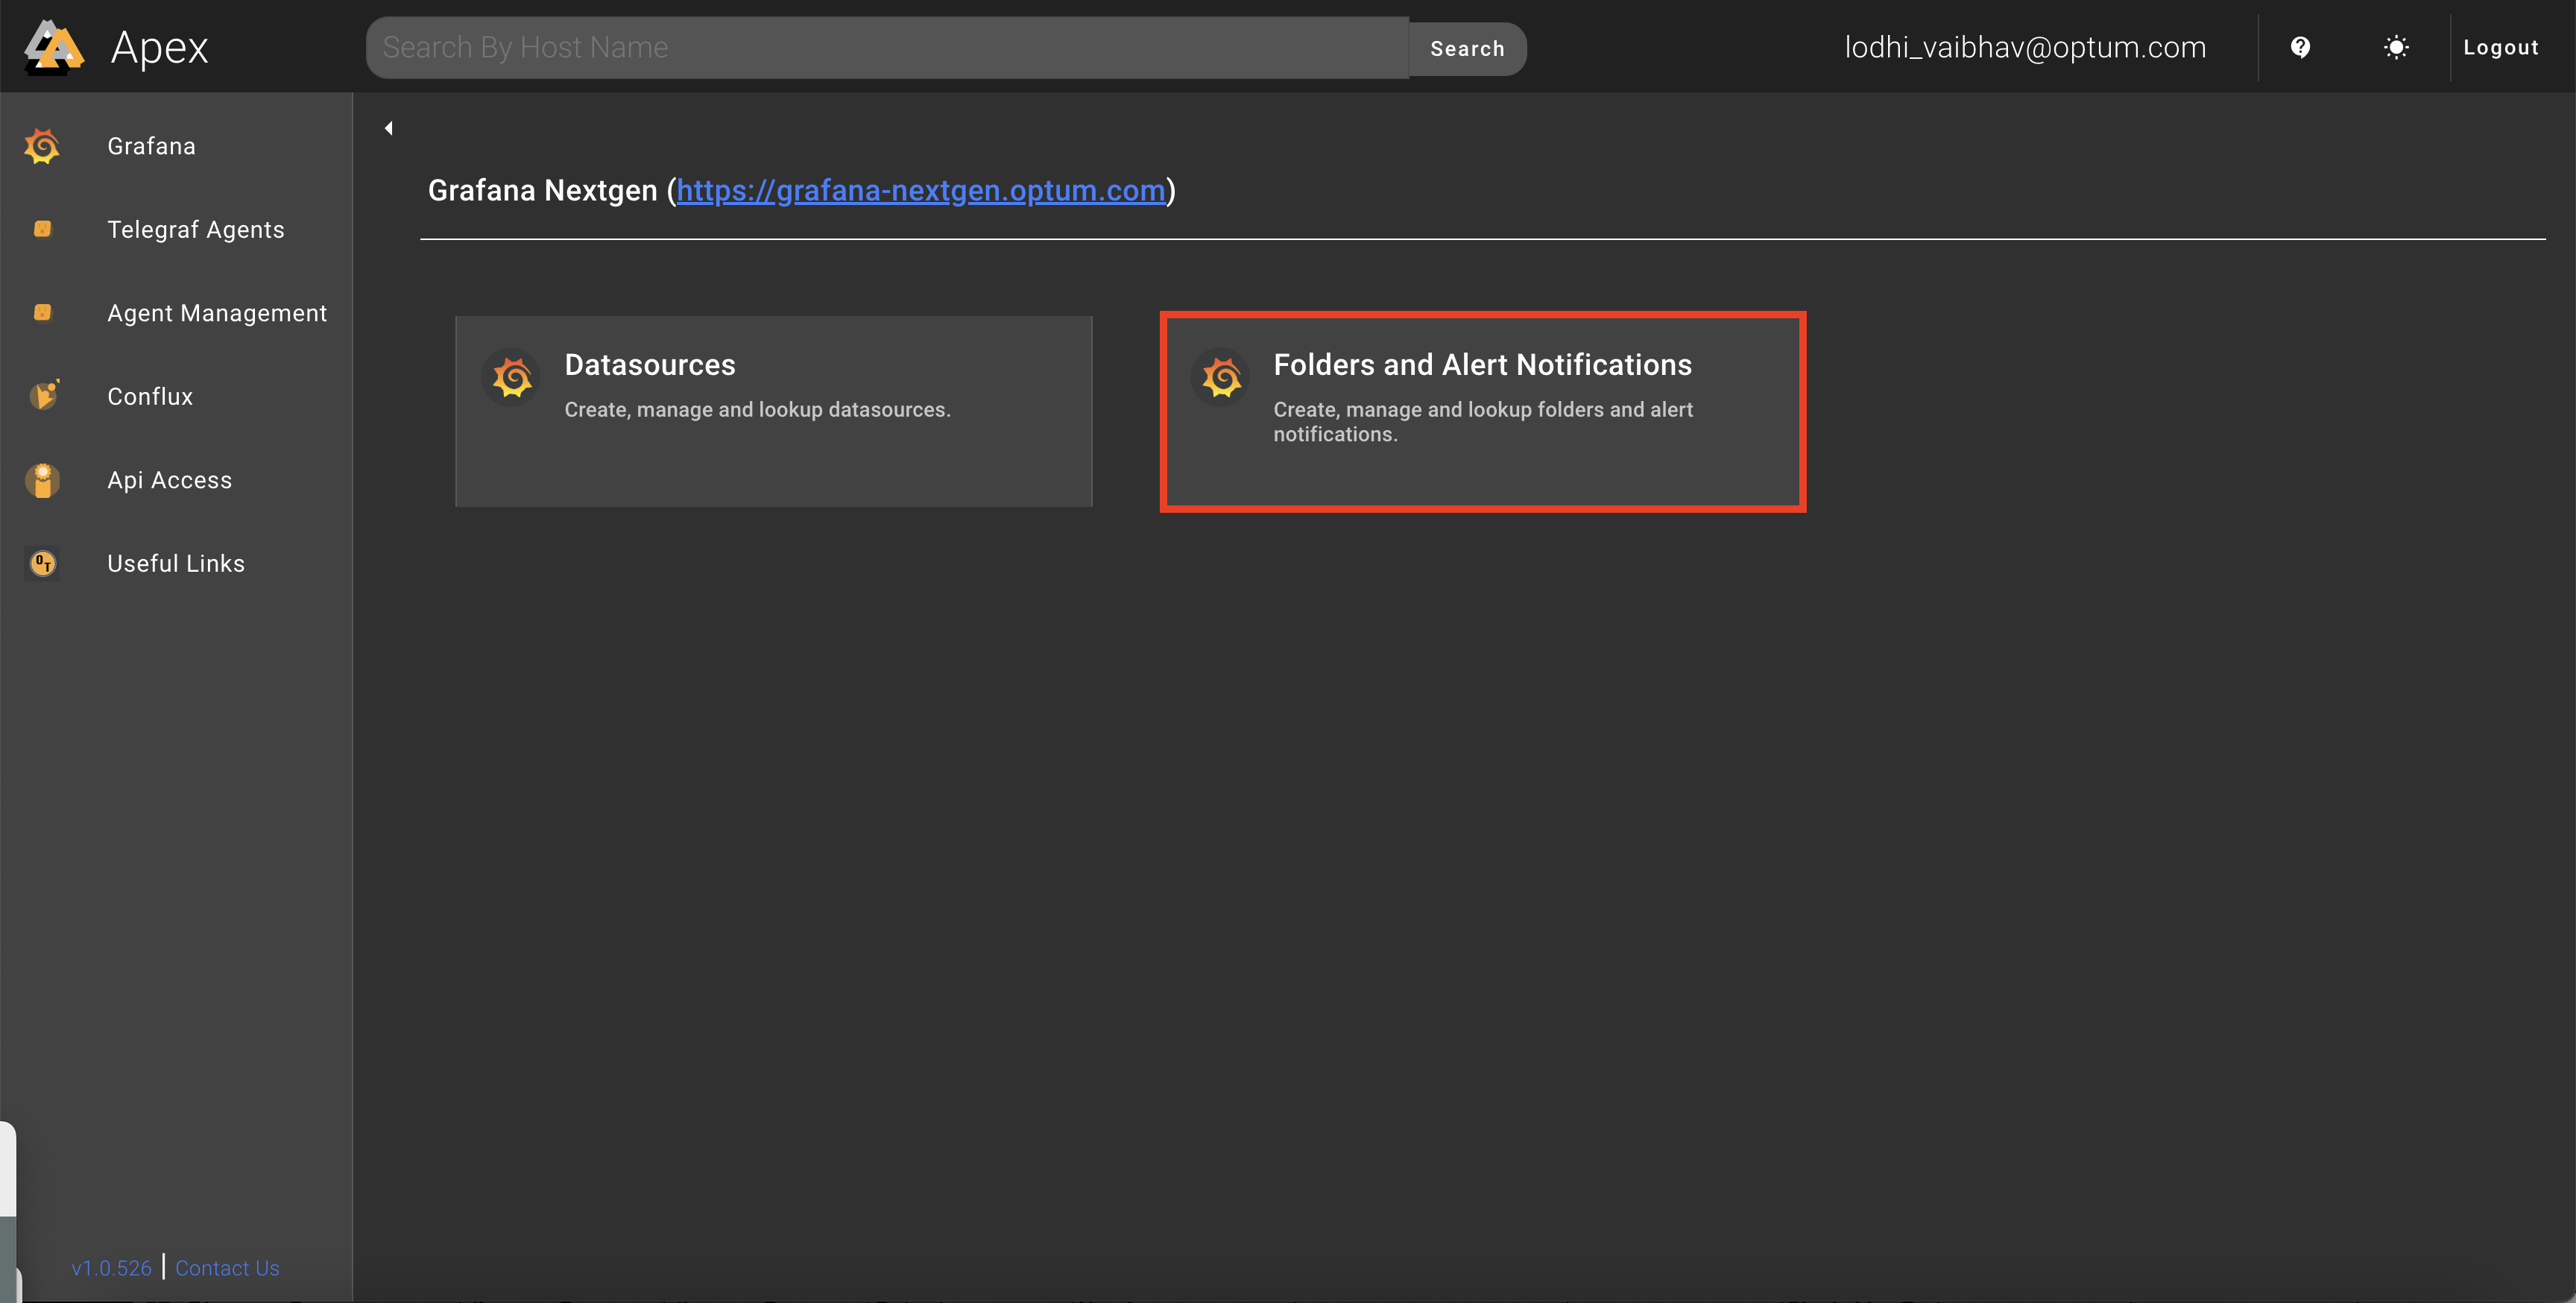
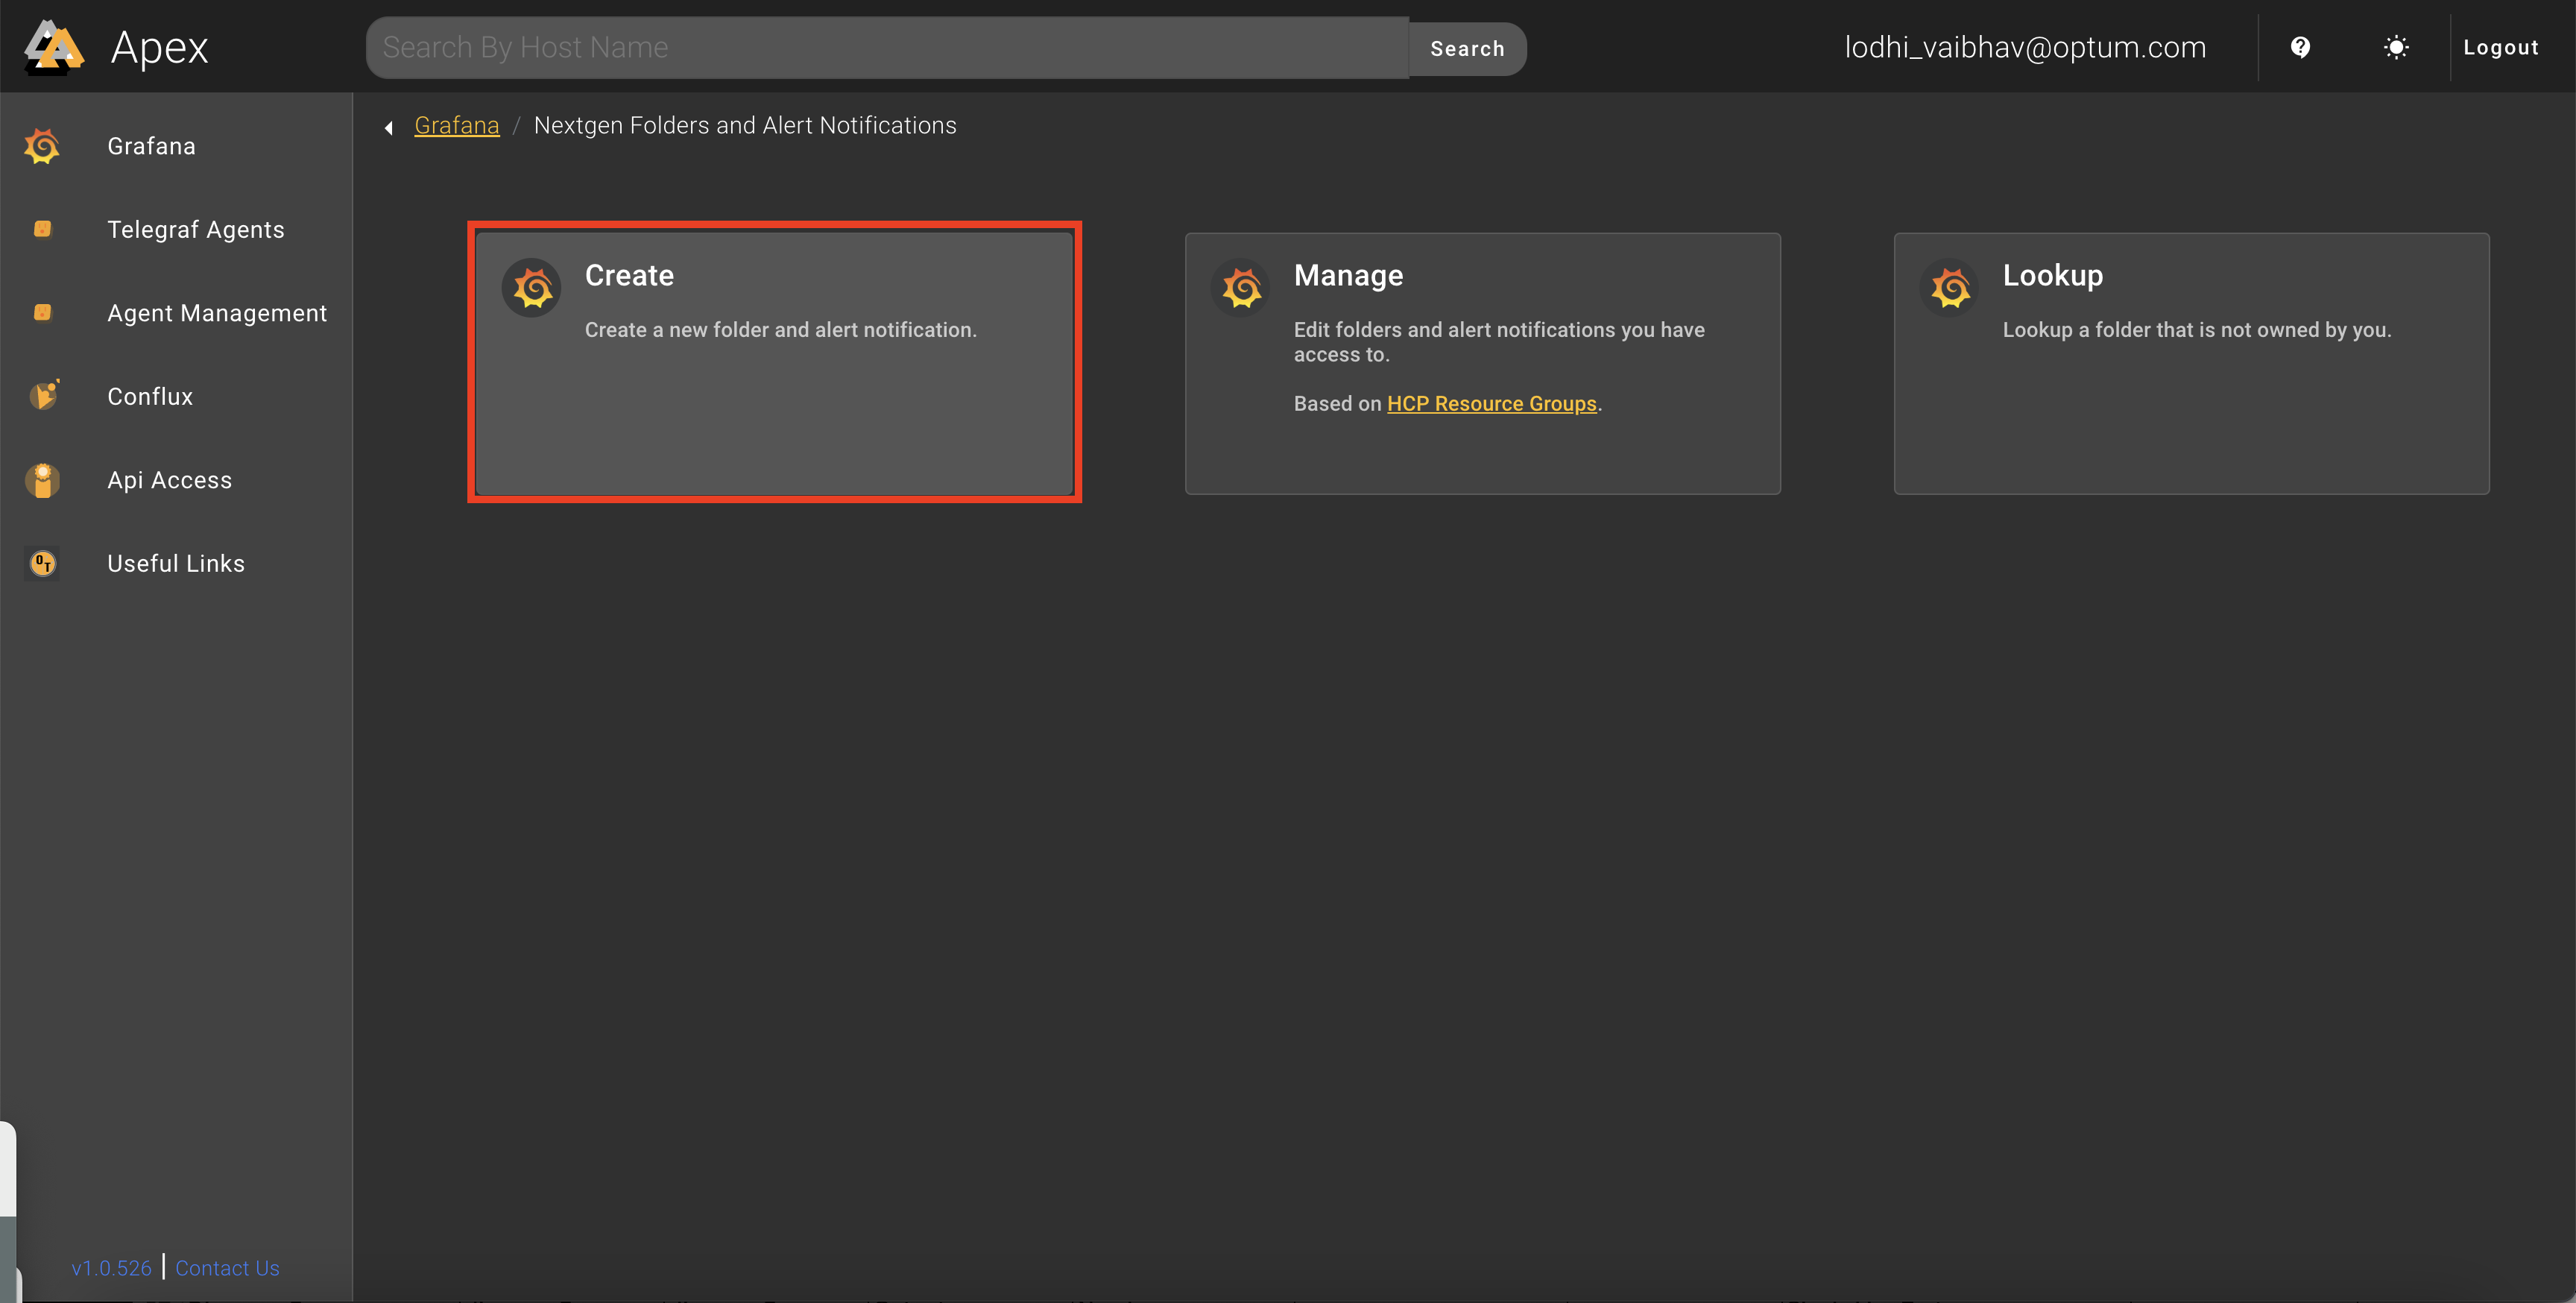
- Fill the Form and Click "Submit".
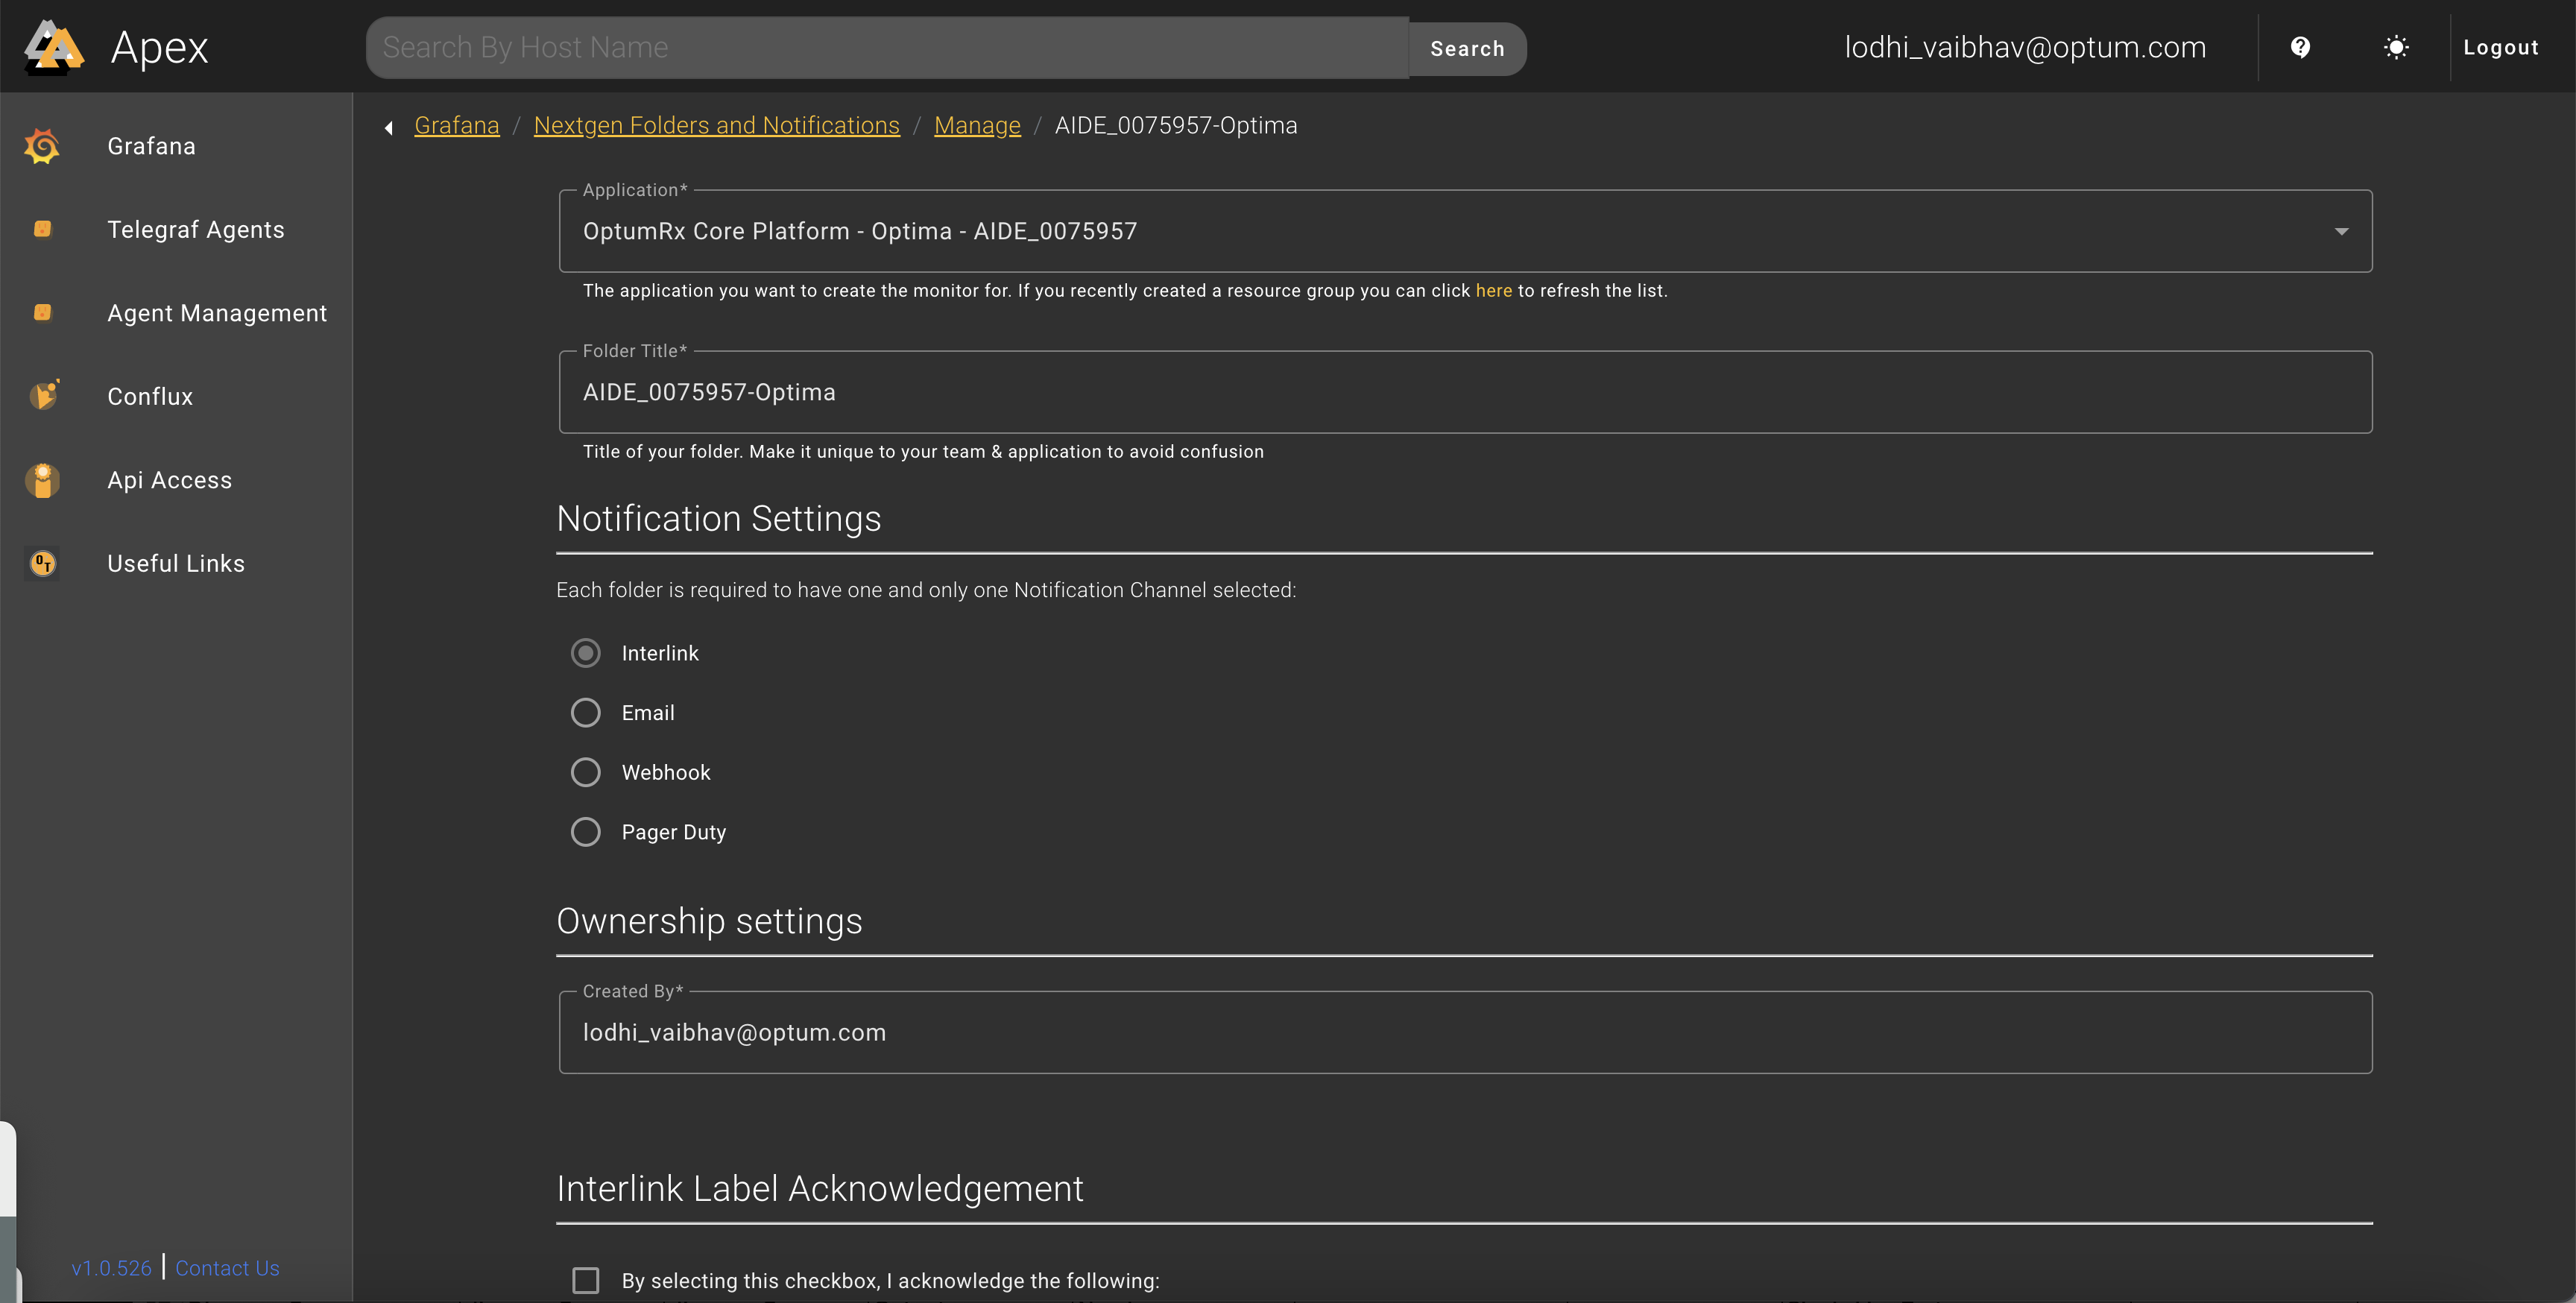
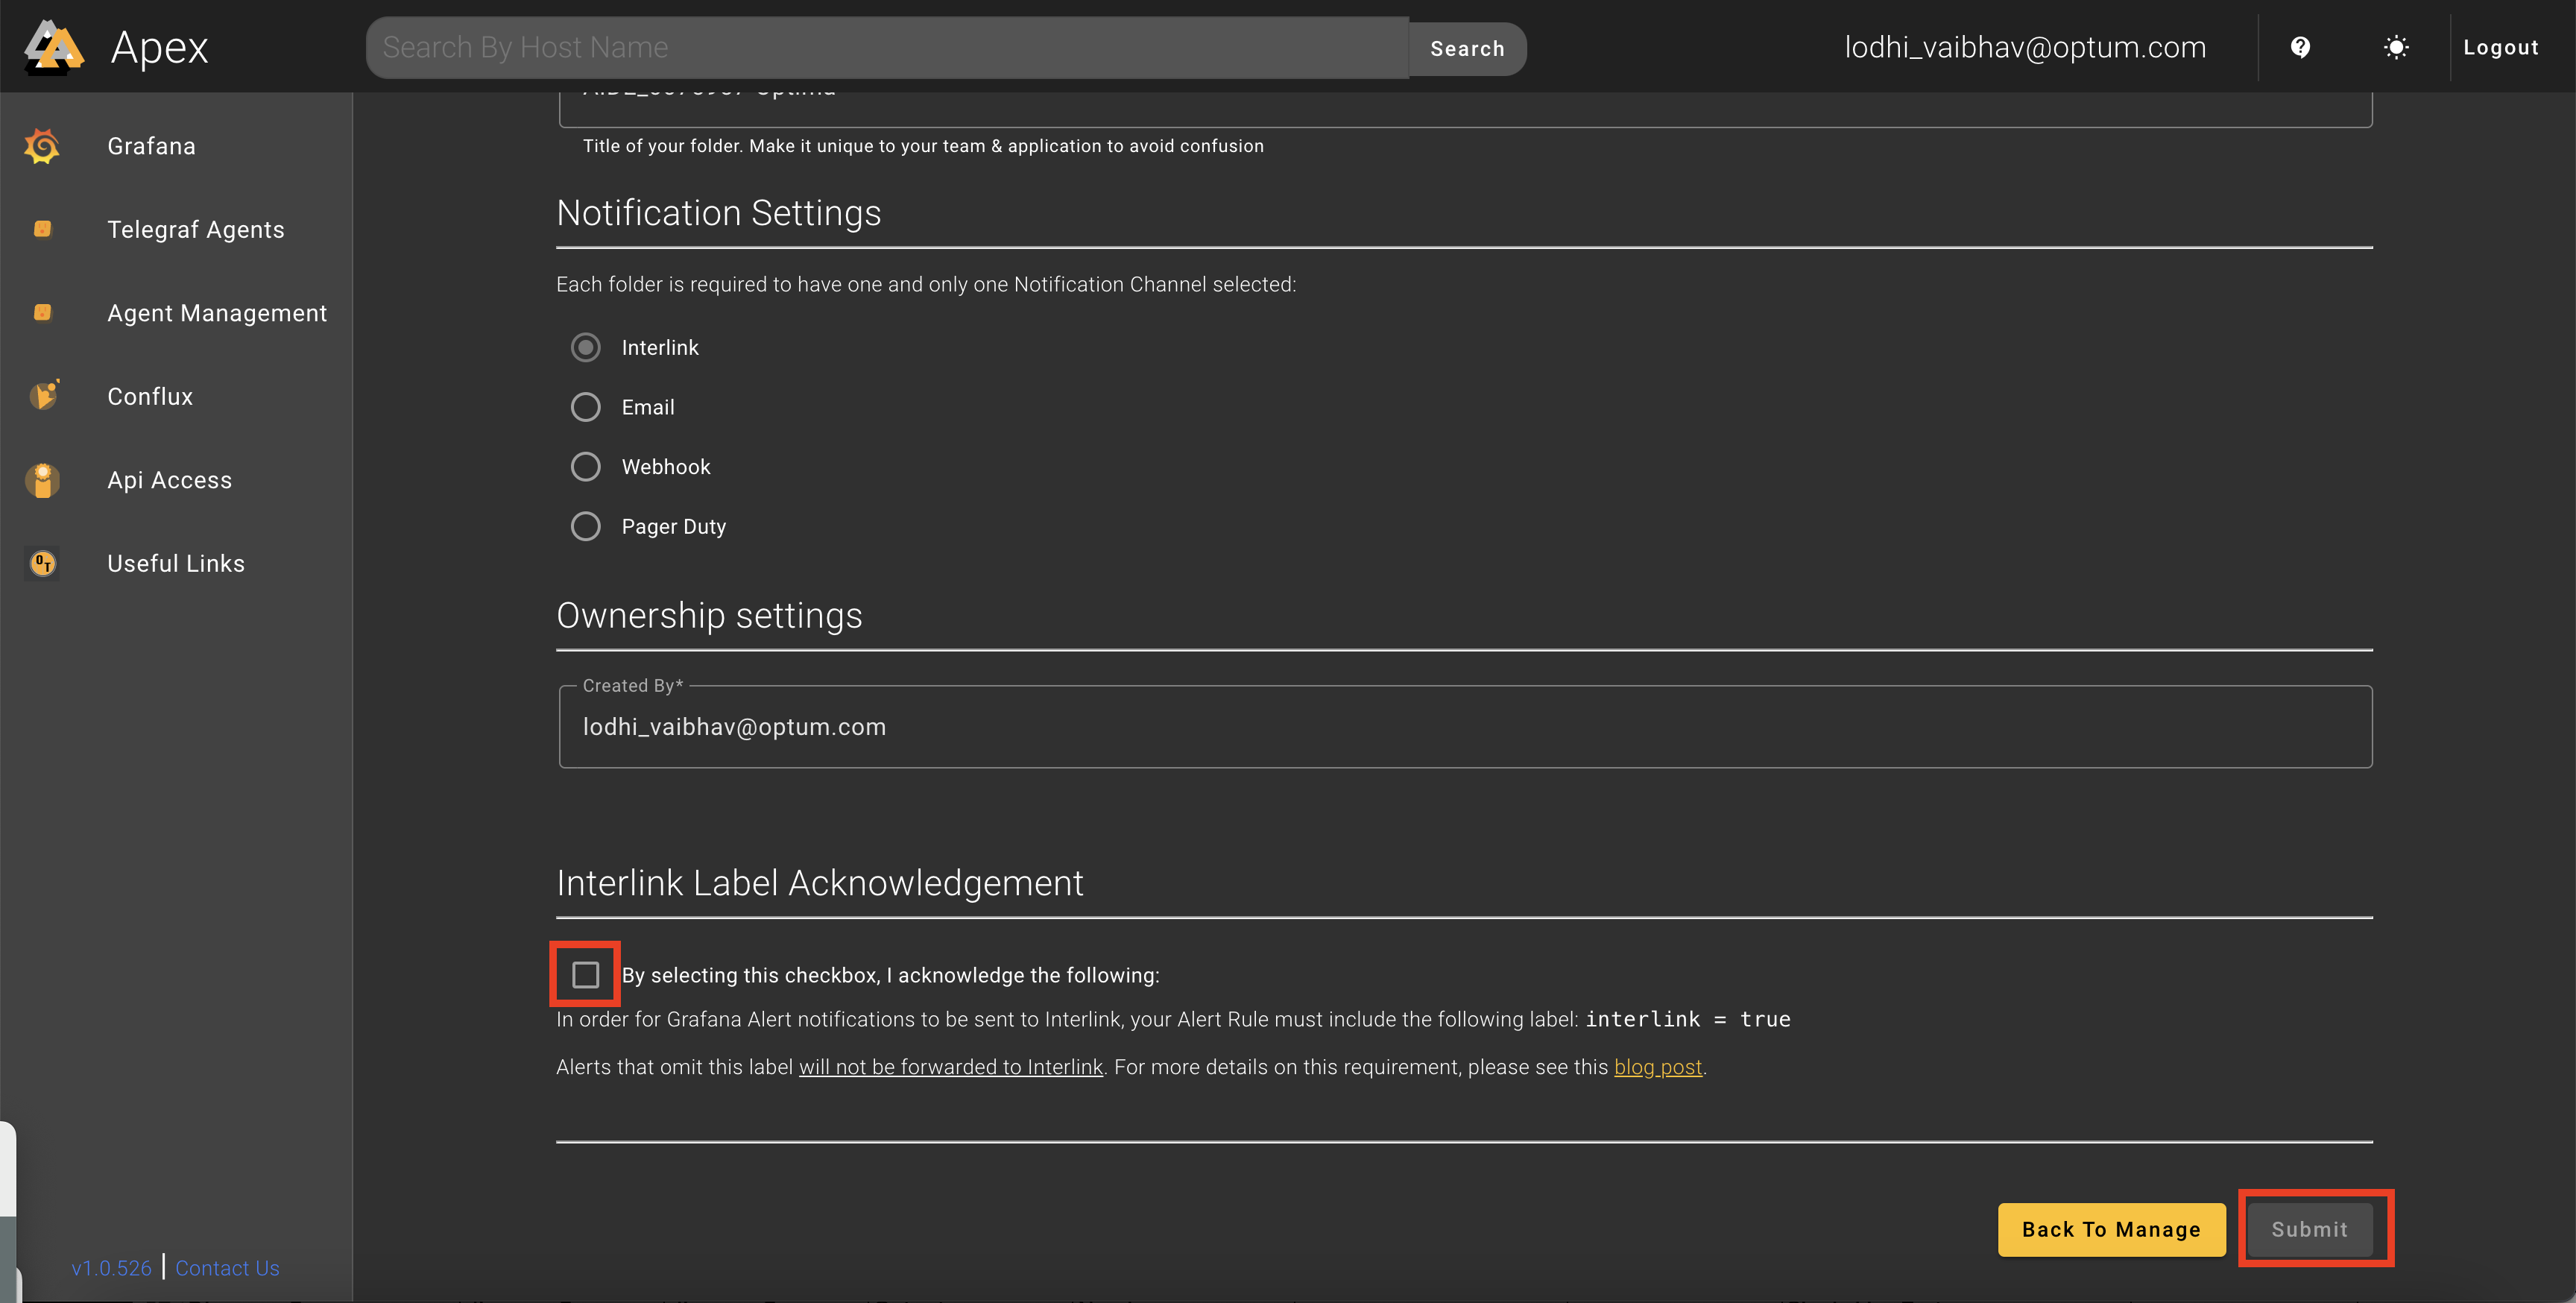
- A Success Message will appear below.
- Done. The folder will now be visible in Grafana.
Requesting Datasource
-
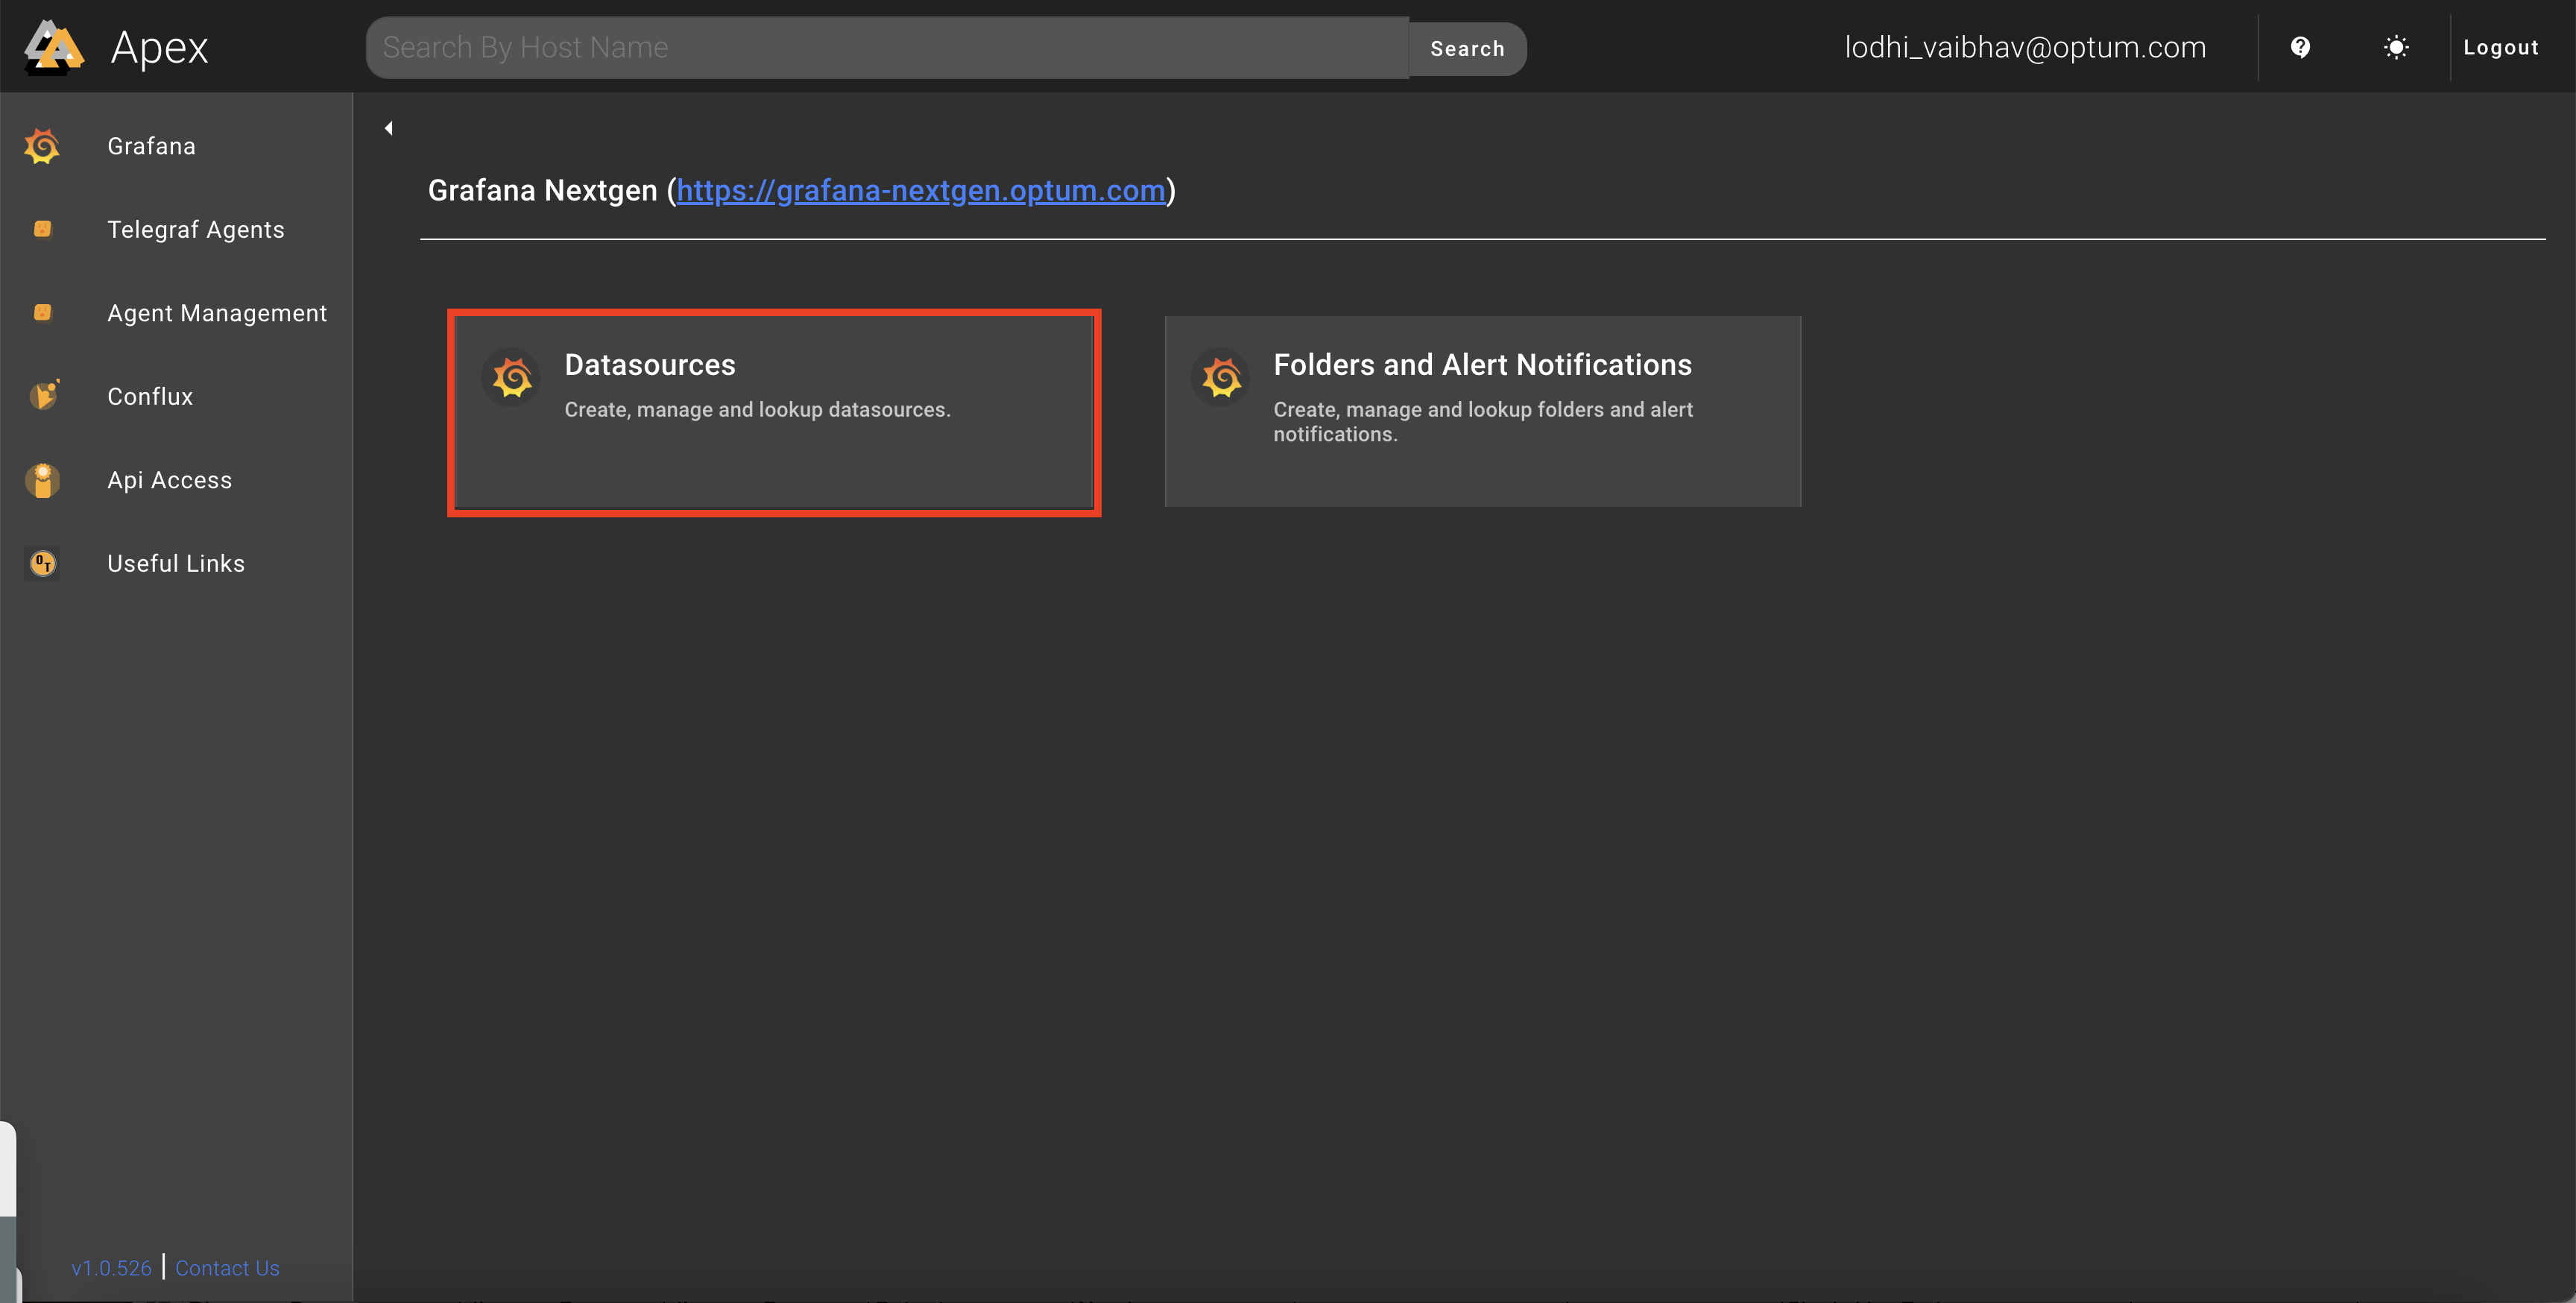
Go to Apex.
-
Click on Grafana.
-
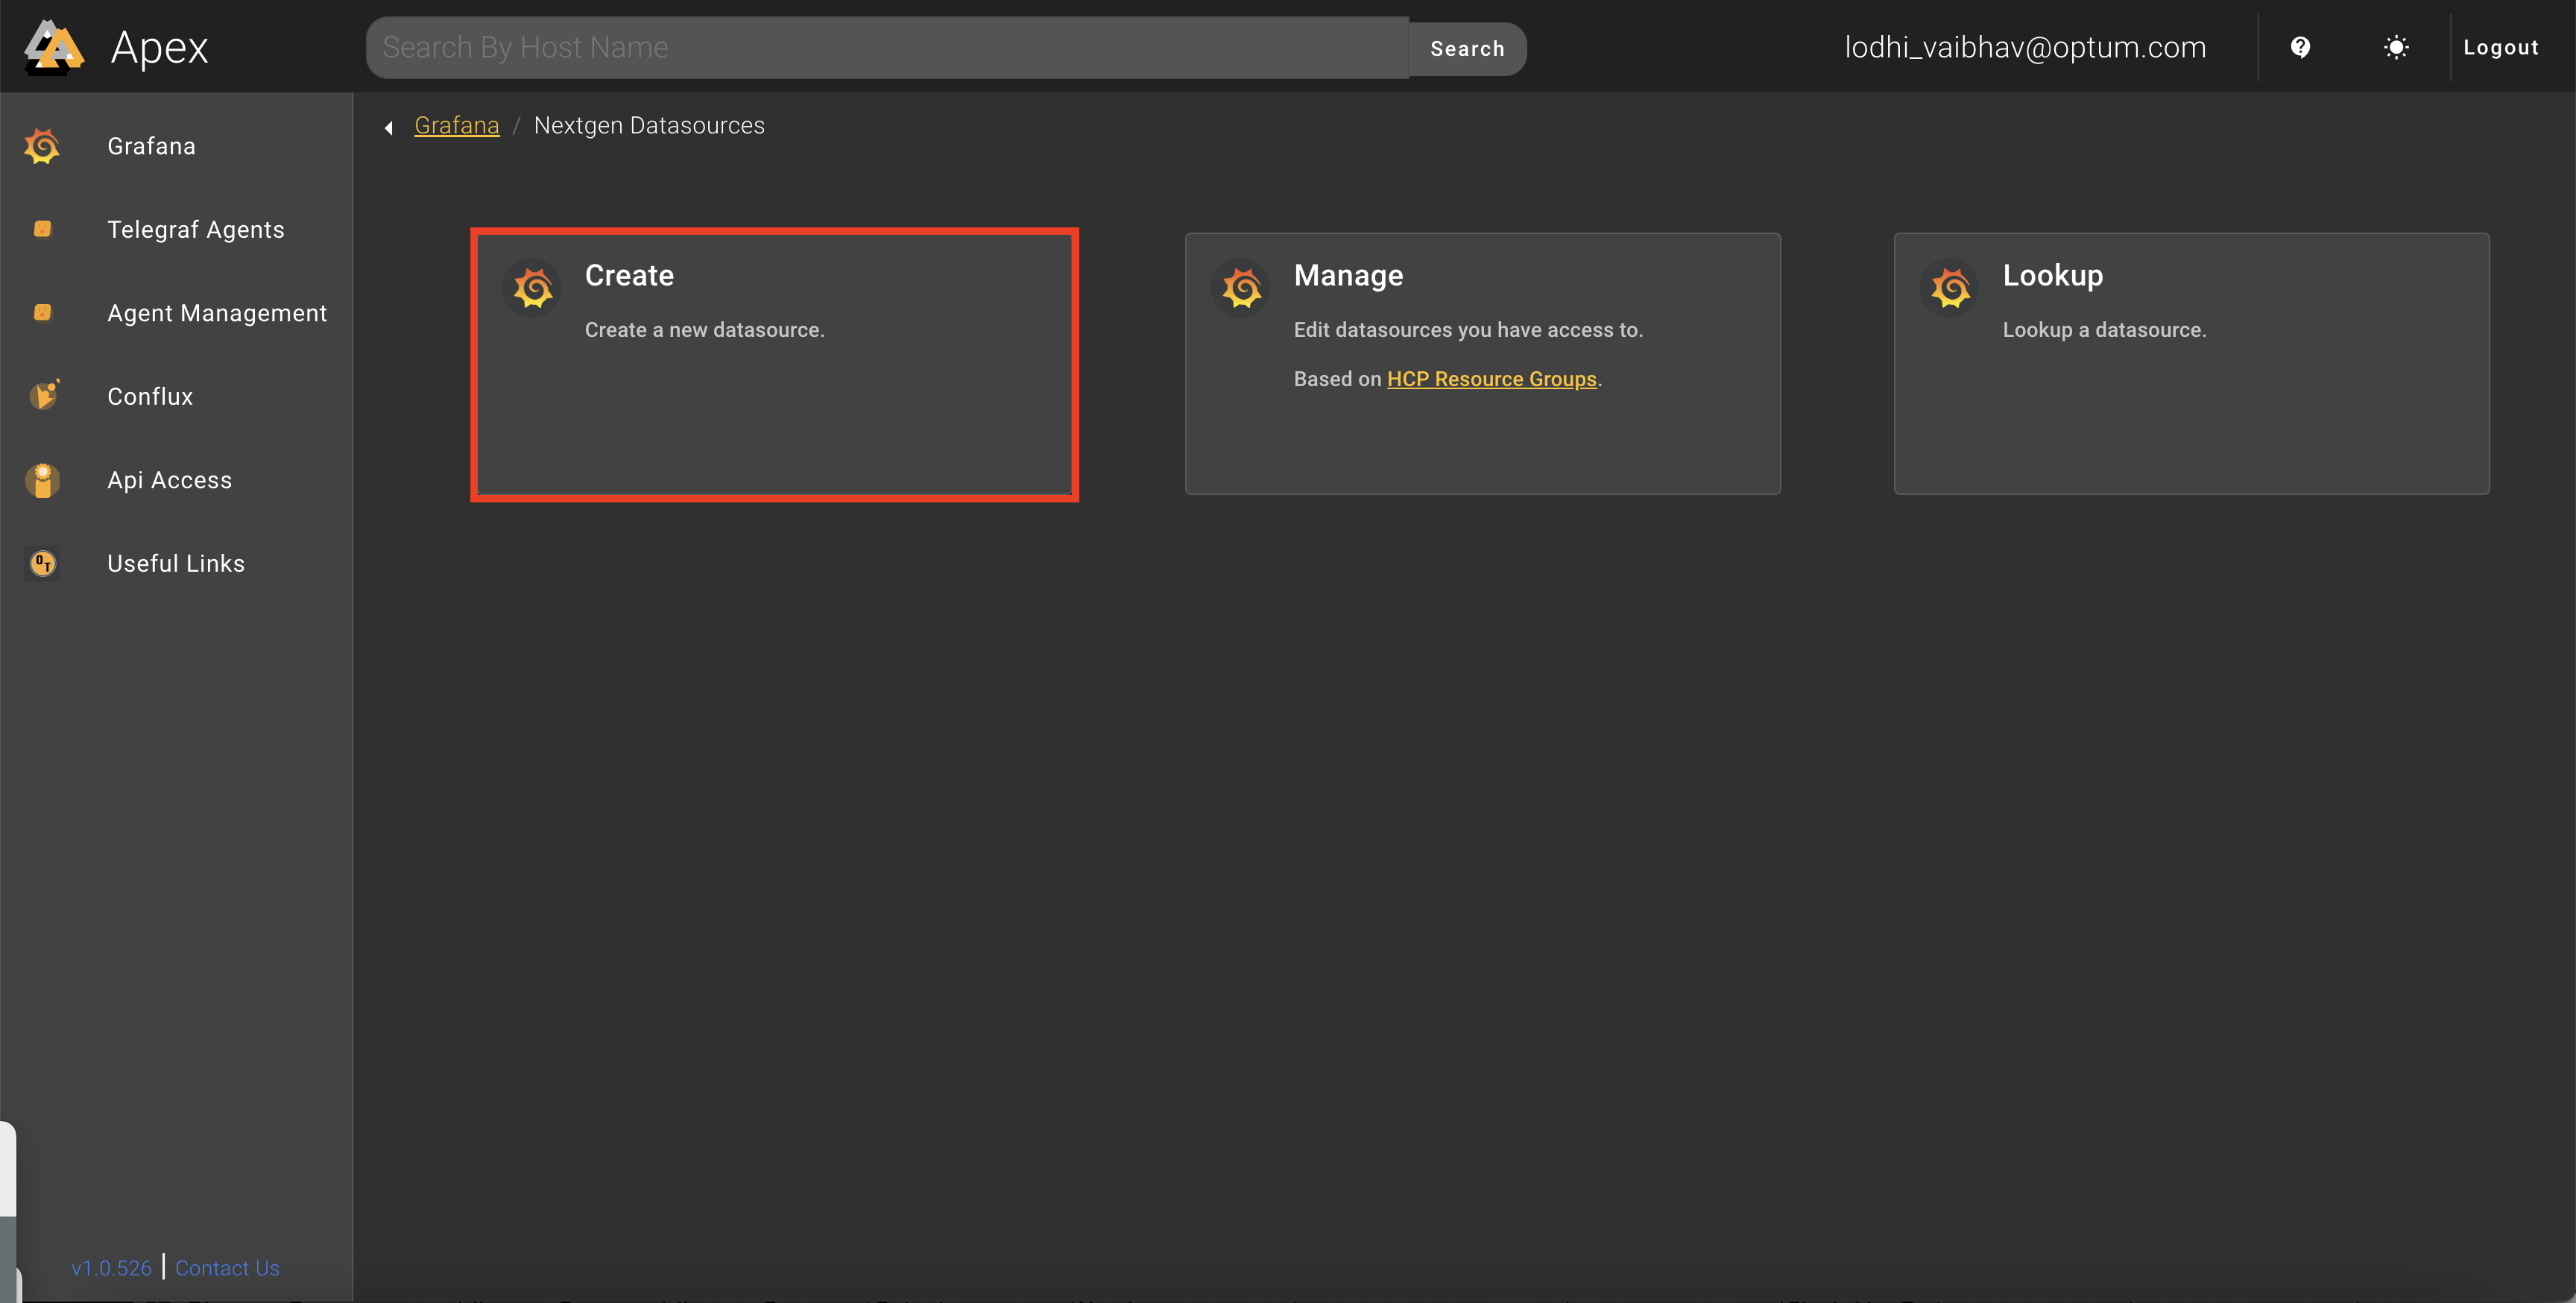
Click on Create.
-
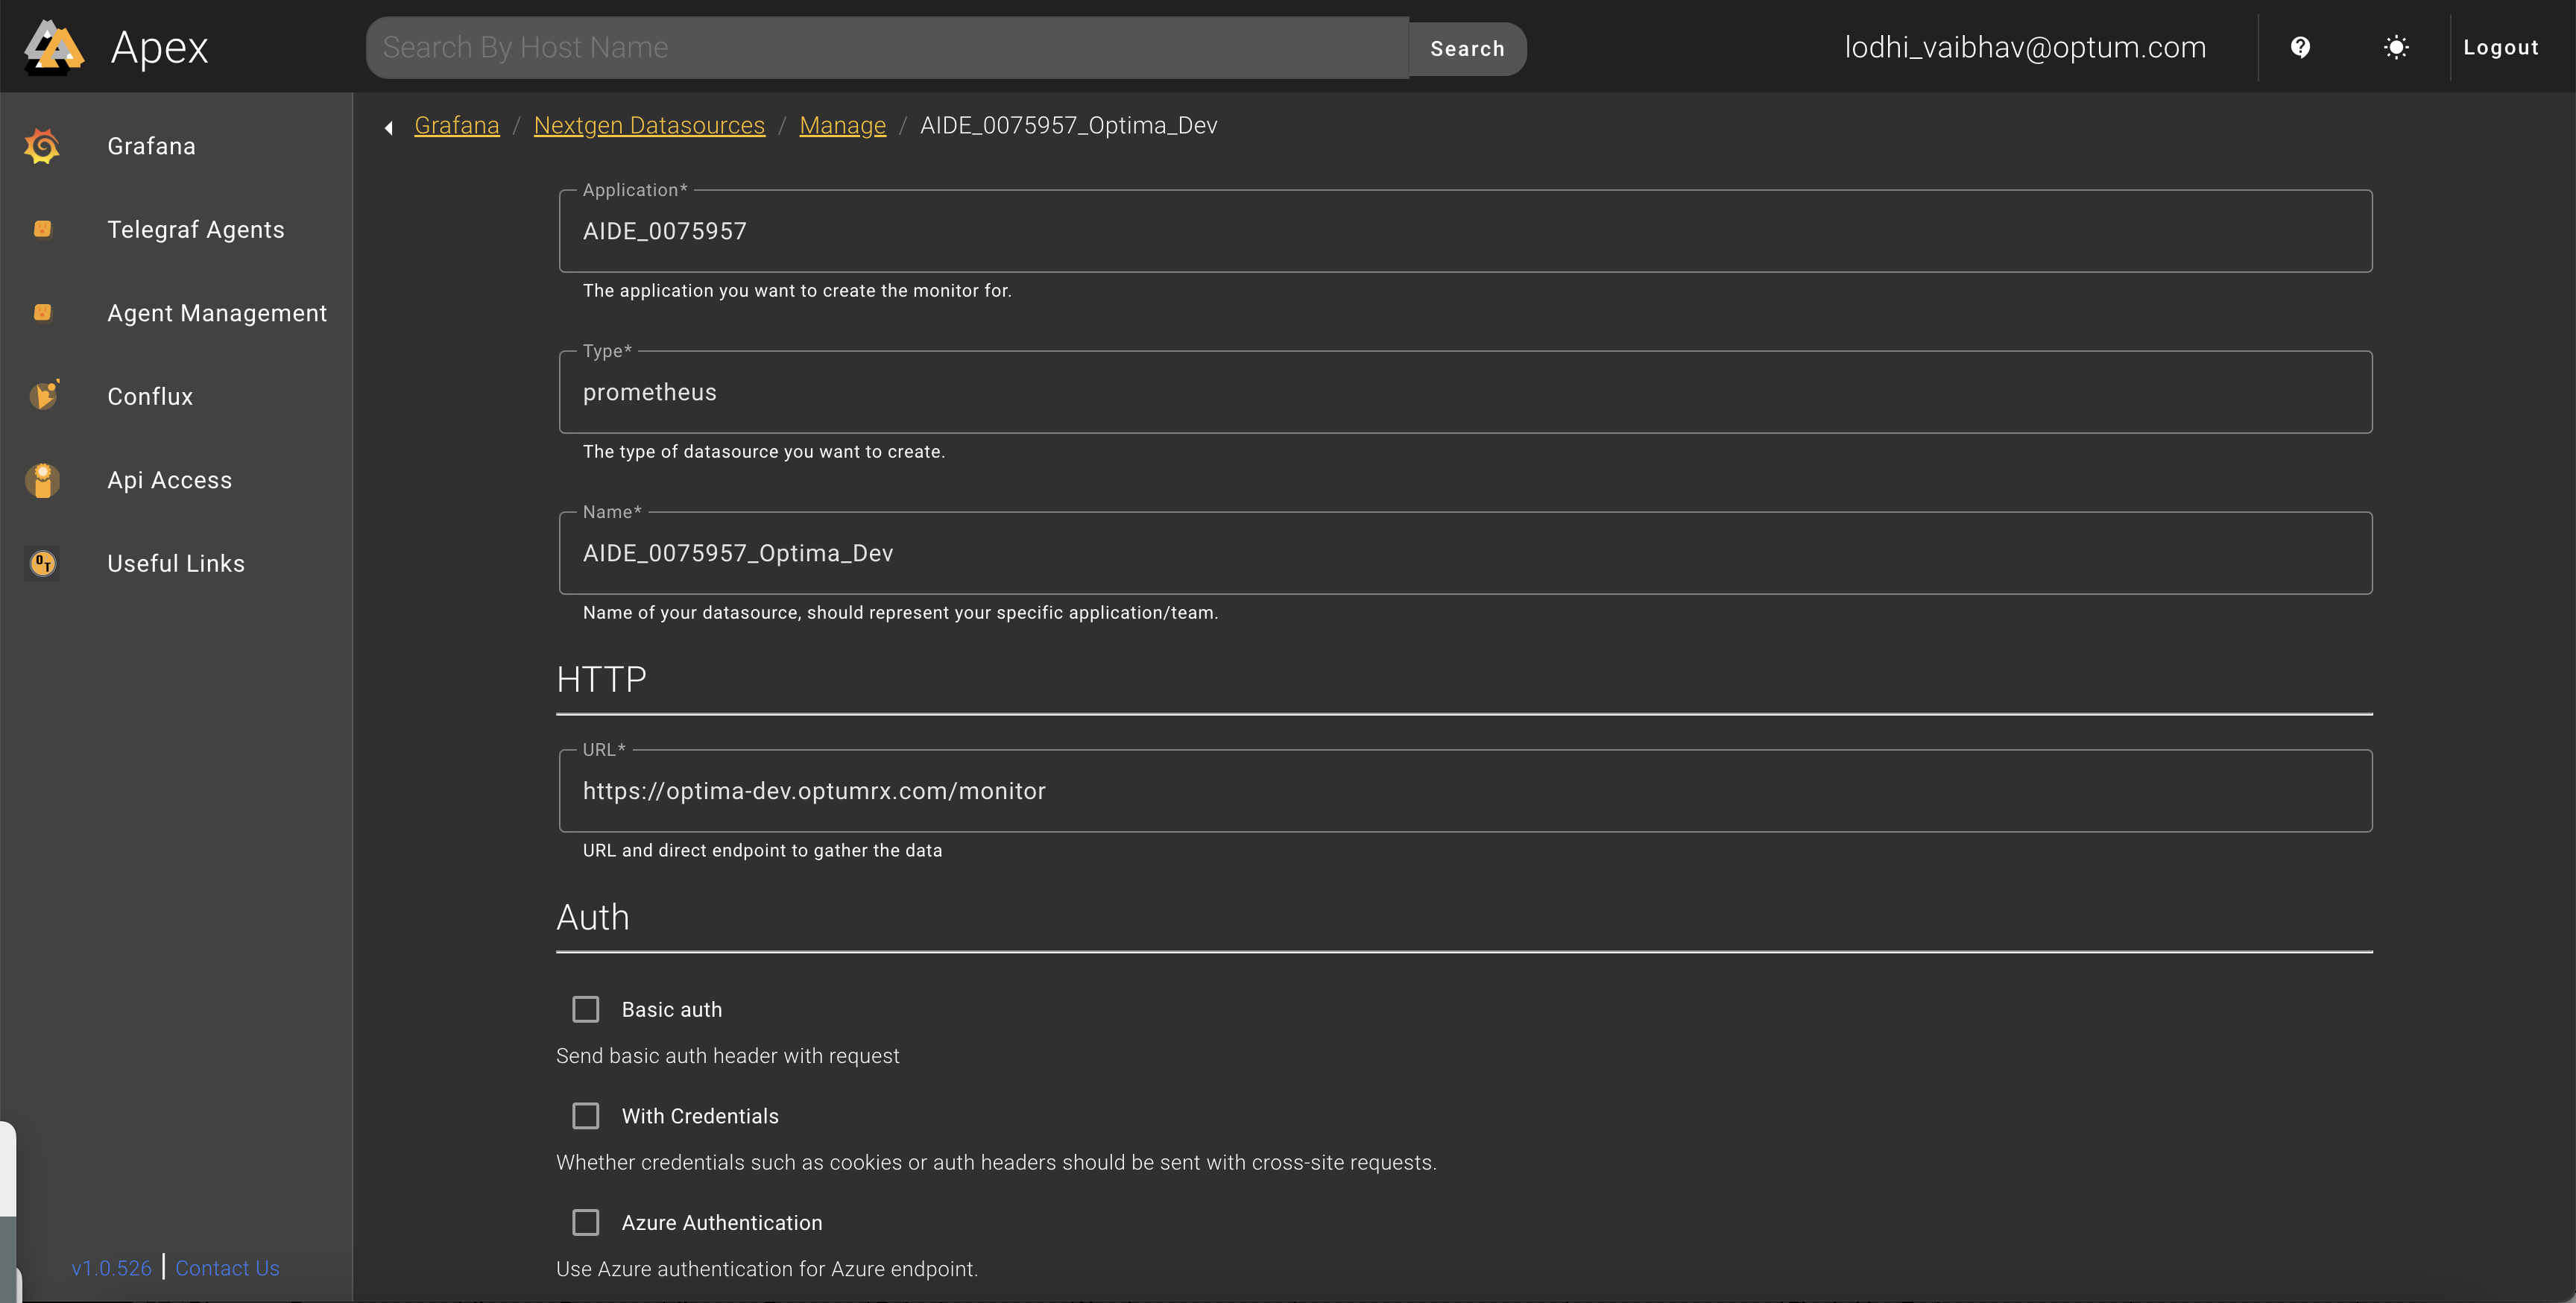
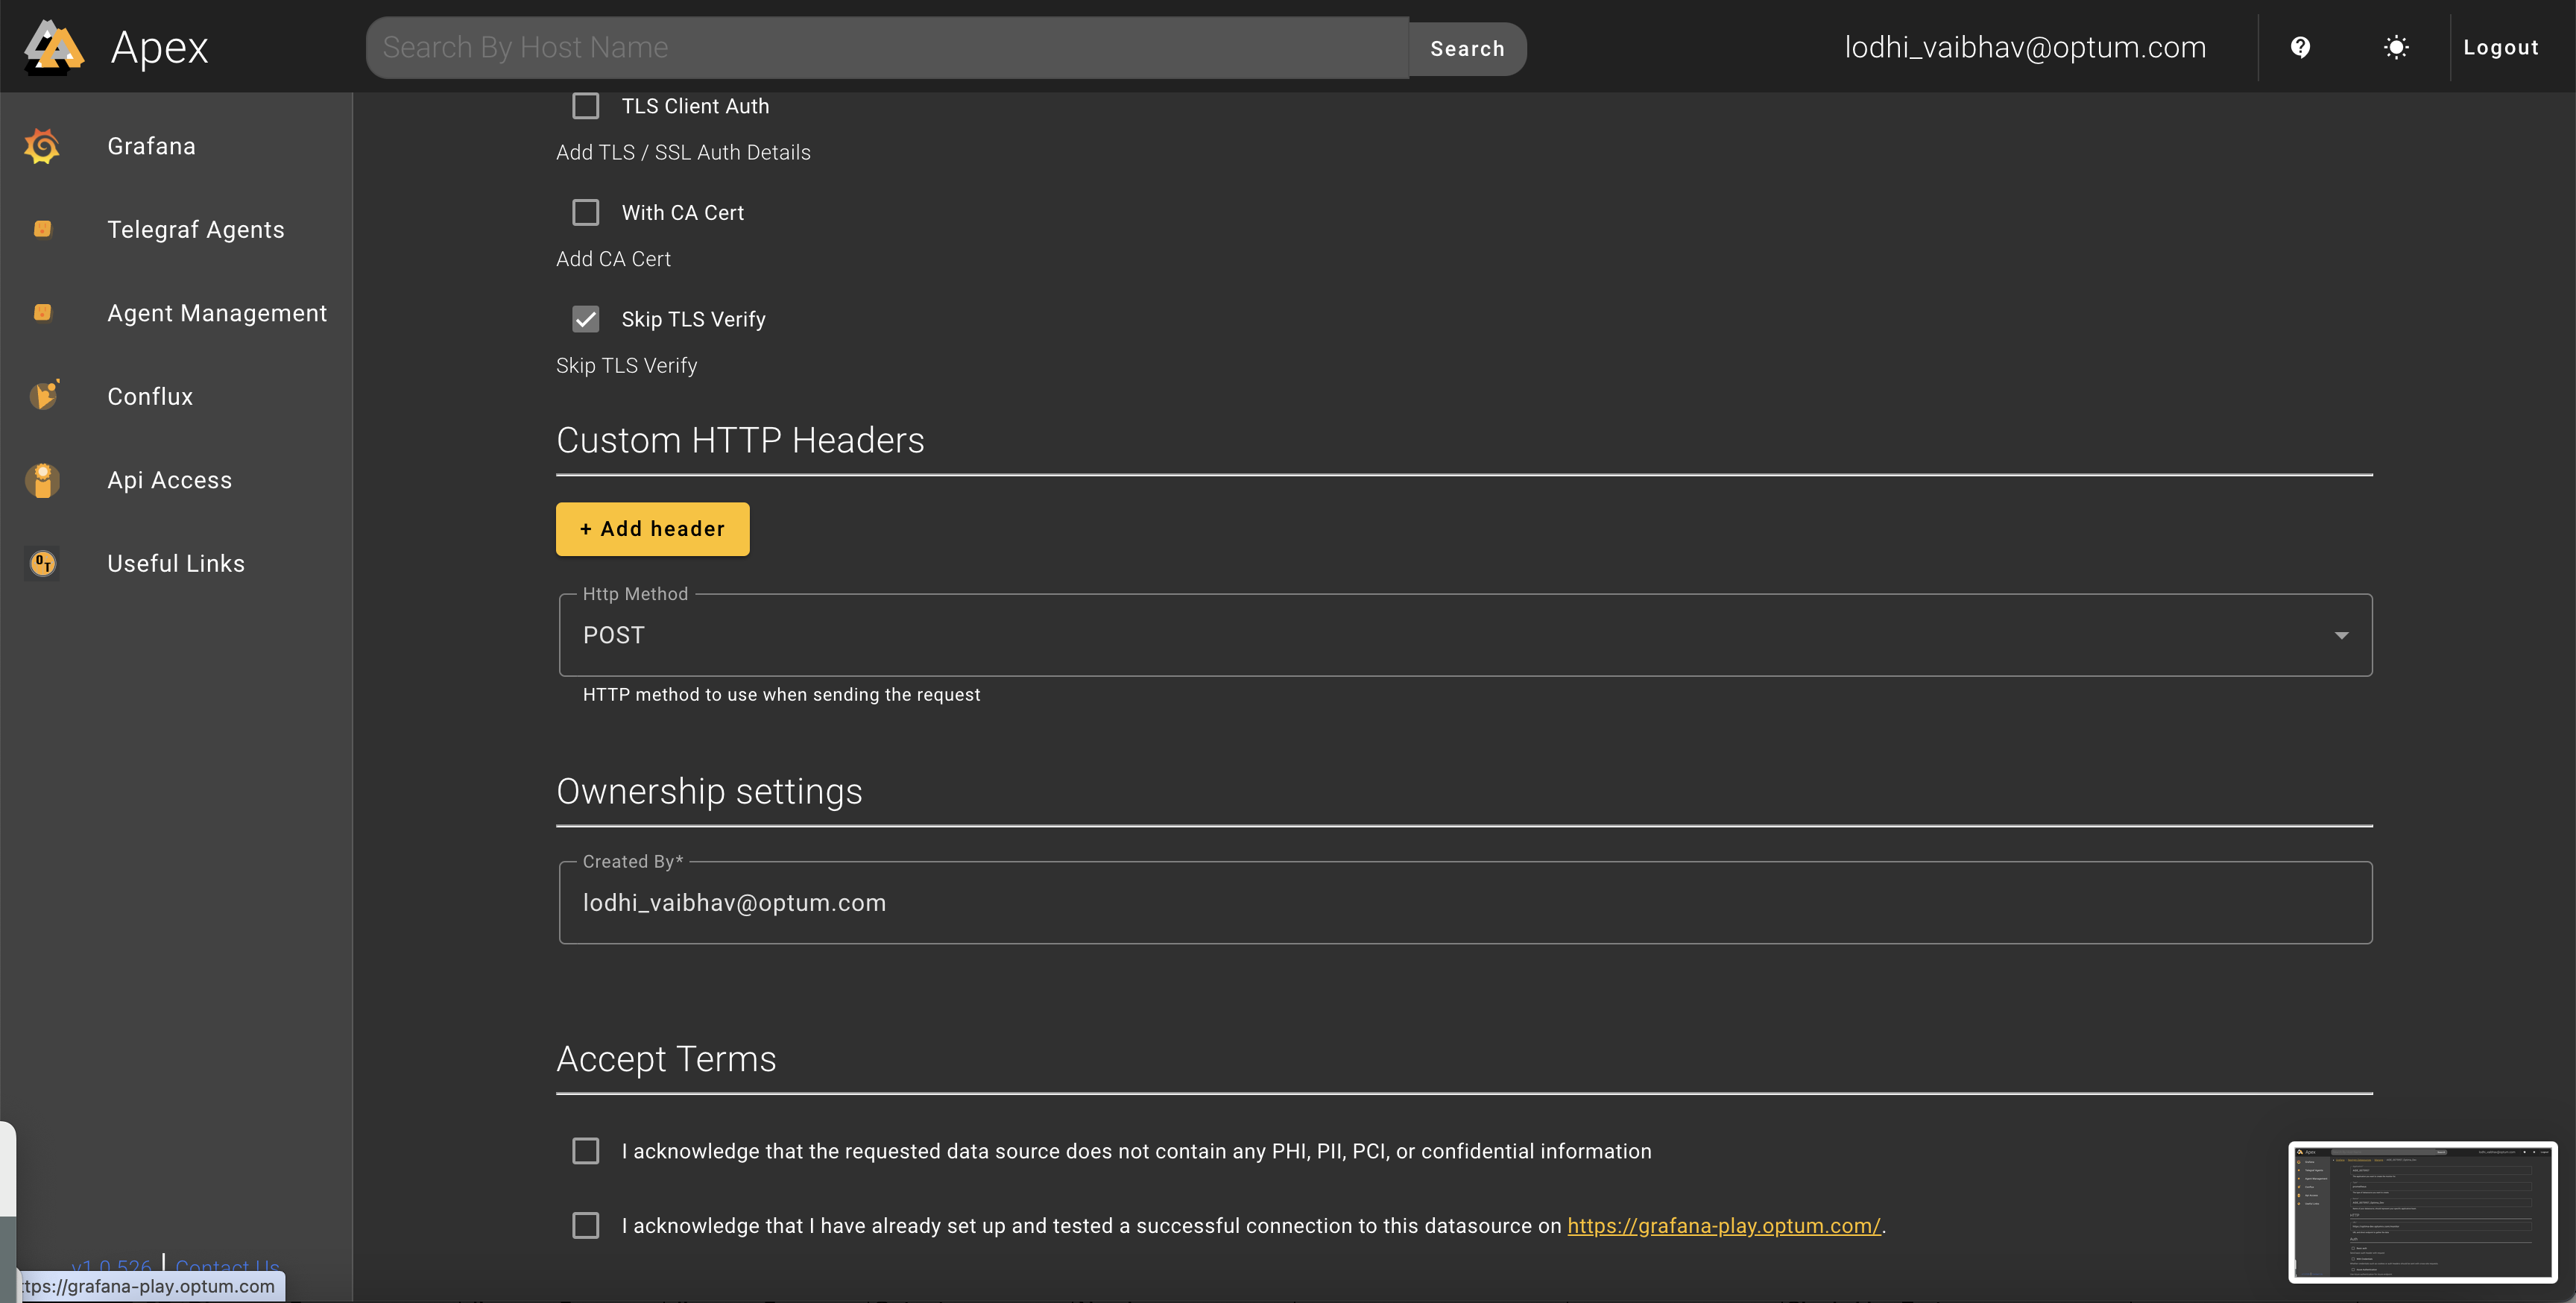
Fill the Form and Click "Submit". Use the prometheus endpoint URL for each environment. Rest you can refer the ScreenShots.
-
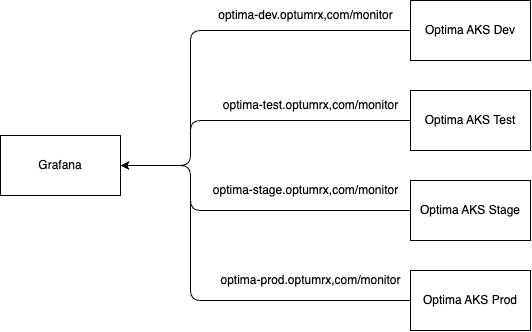
For Dev: https://optima-dev.optumrx.com/monitor
-
For Stage: https://optima-stage.optumrx.com/monitor
-
For Test: https://optima-test.optumrx.com/monitor
-
For Prod: https://optima-prod.optumrx.com/monitor
-
-
A Success Message will appear below.
-
Done. The datasource will now be visible in Grafana.
Deploying Prometheus
-
All the monitoring components are packed into a Helm Chart stored in above repository. The values of deployments are controlled from the values.yaml file.
-
The size of storage for Prometheus is controlled here
-
The data retention is controlled here. The retention and size of storage are directly proportional.
-
The configuration of Prometheus is maintained here. It is a custom configuration that captures the camunda components metrics from all the namespaces starting with optima-*.
-
Jenkins pipeline is created to deploy this. Jenkins Link.
Importing Grafana Dashboards
-
Download/Prepare a JSON for the Dashboard.
-
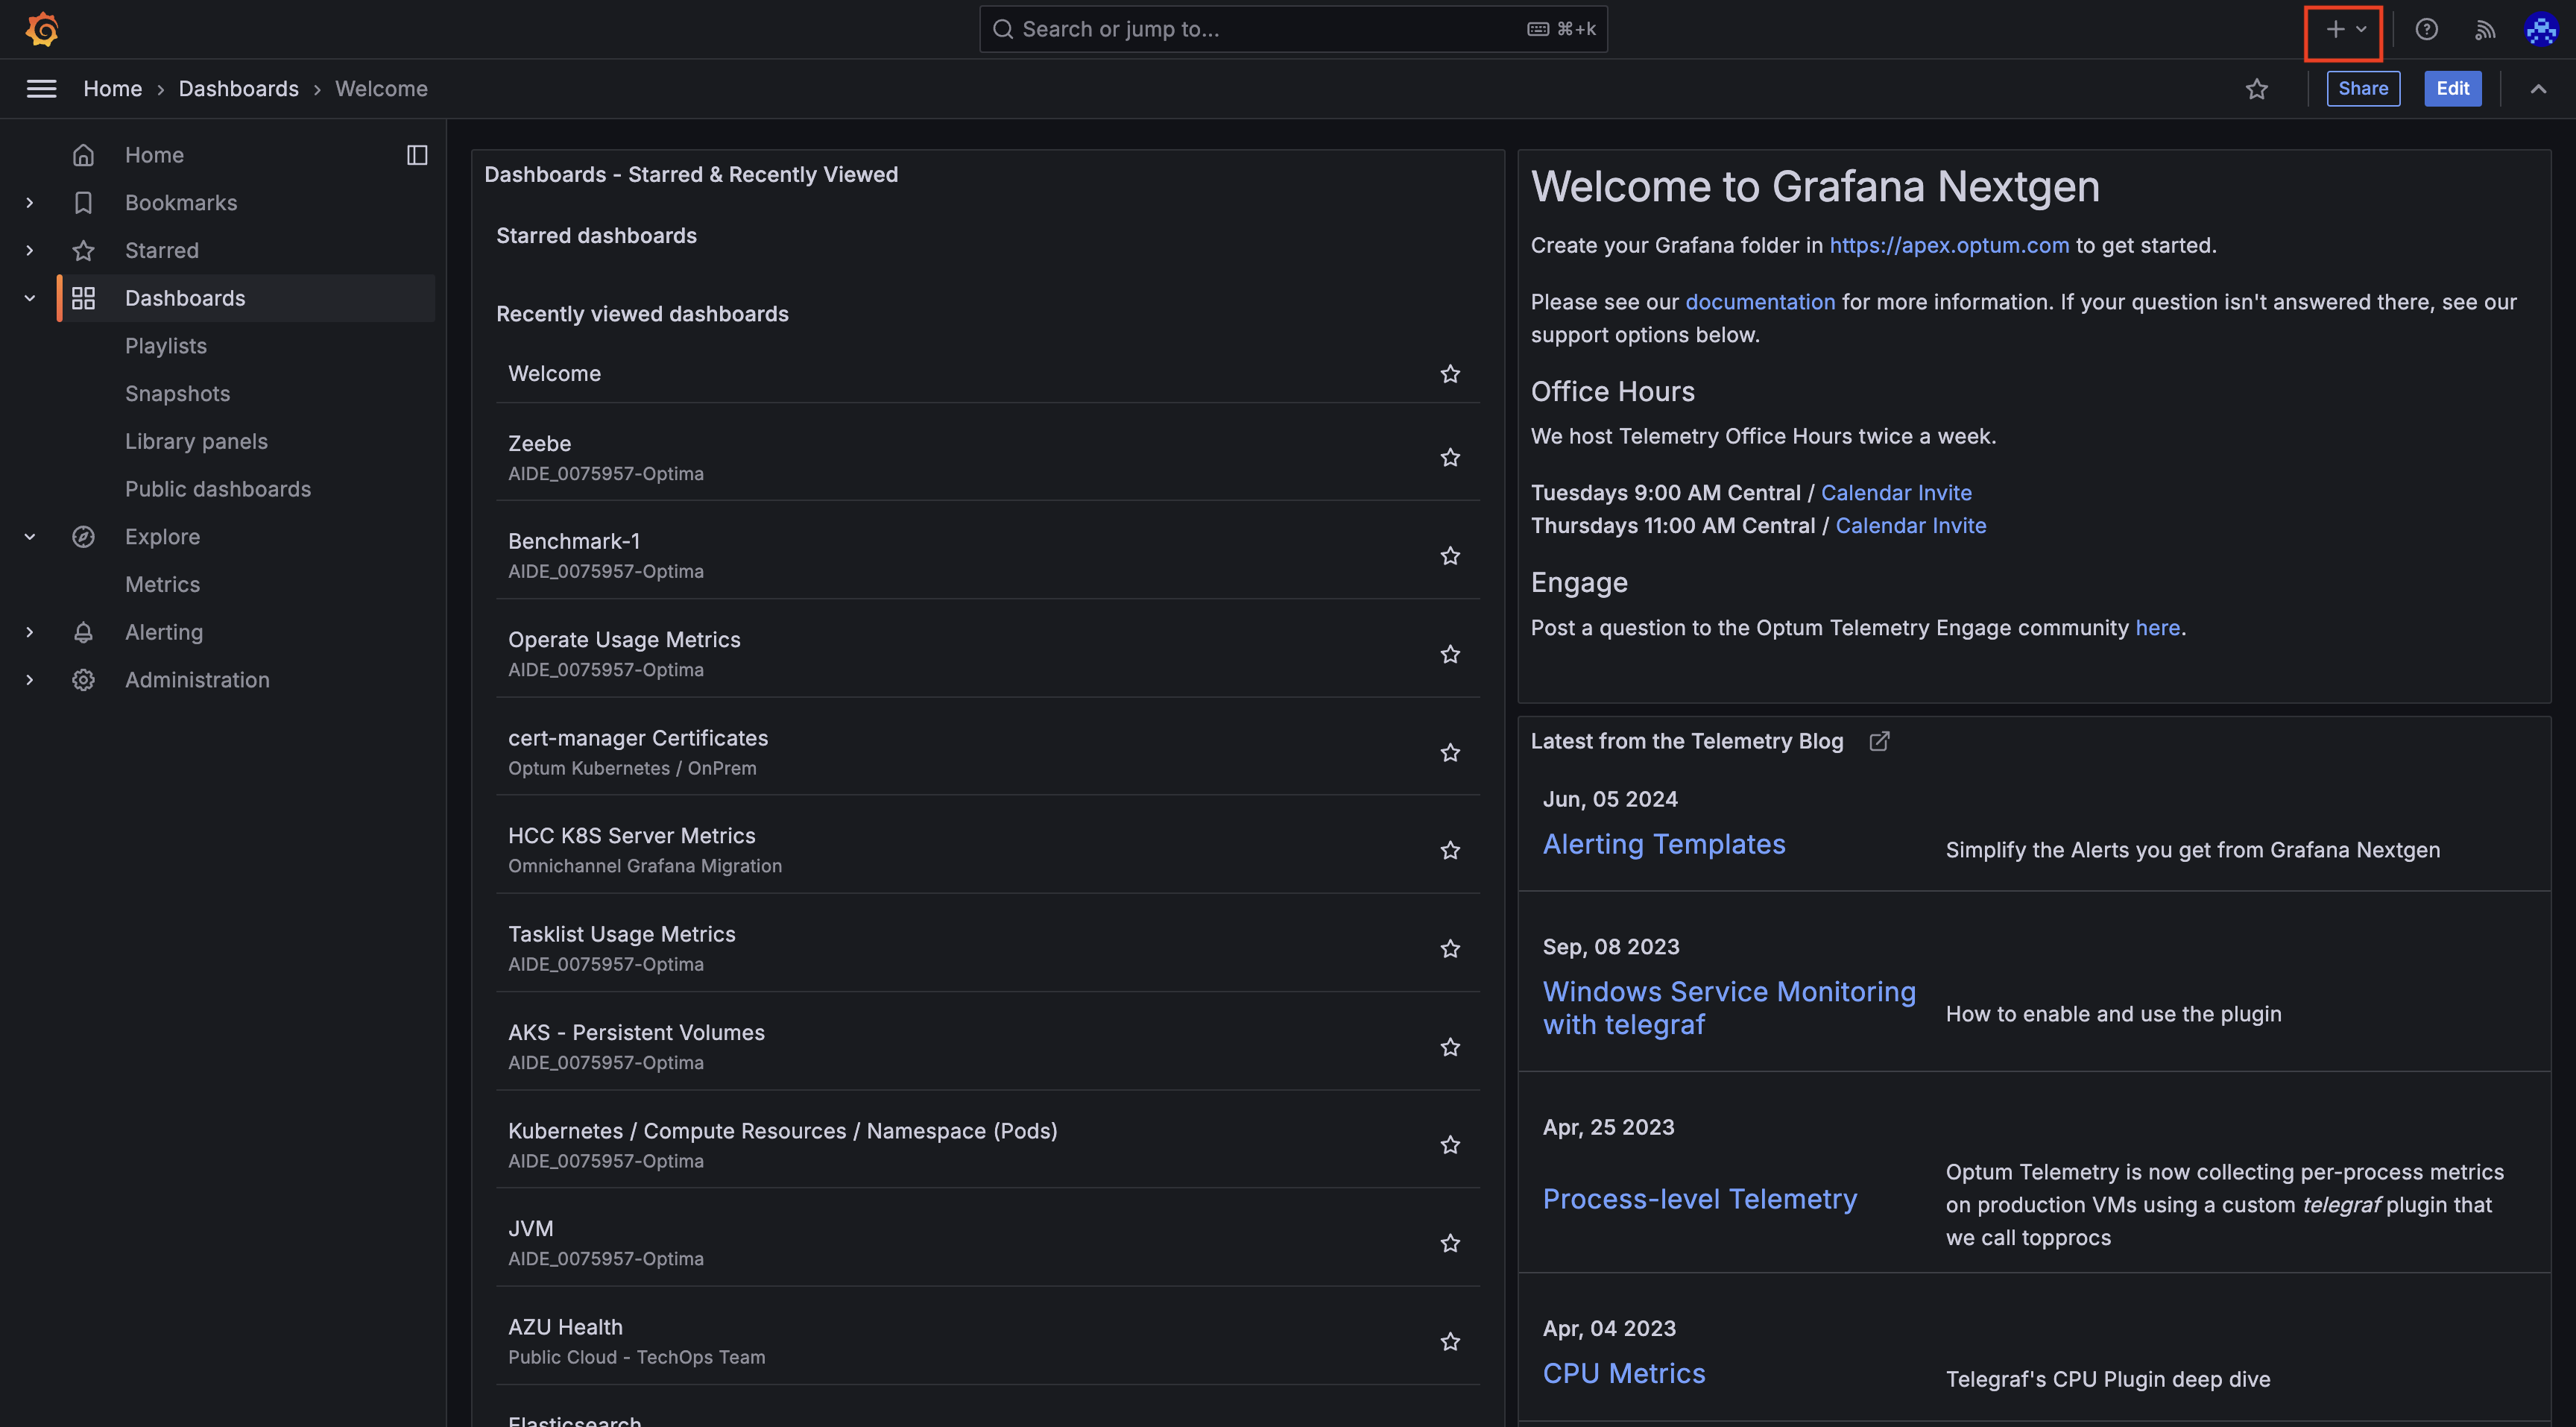
Go to Grafana. Click on the Plus Button on Top Right.
-
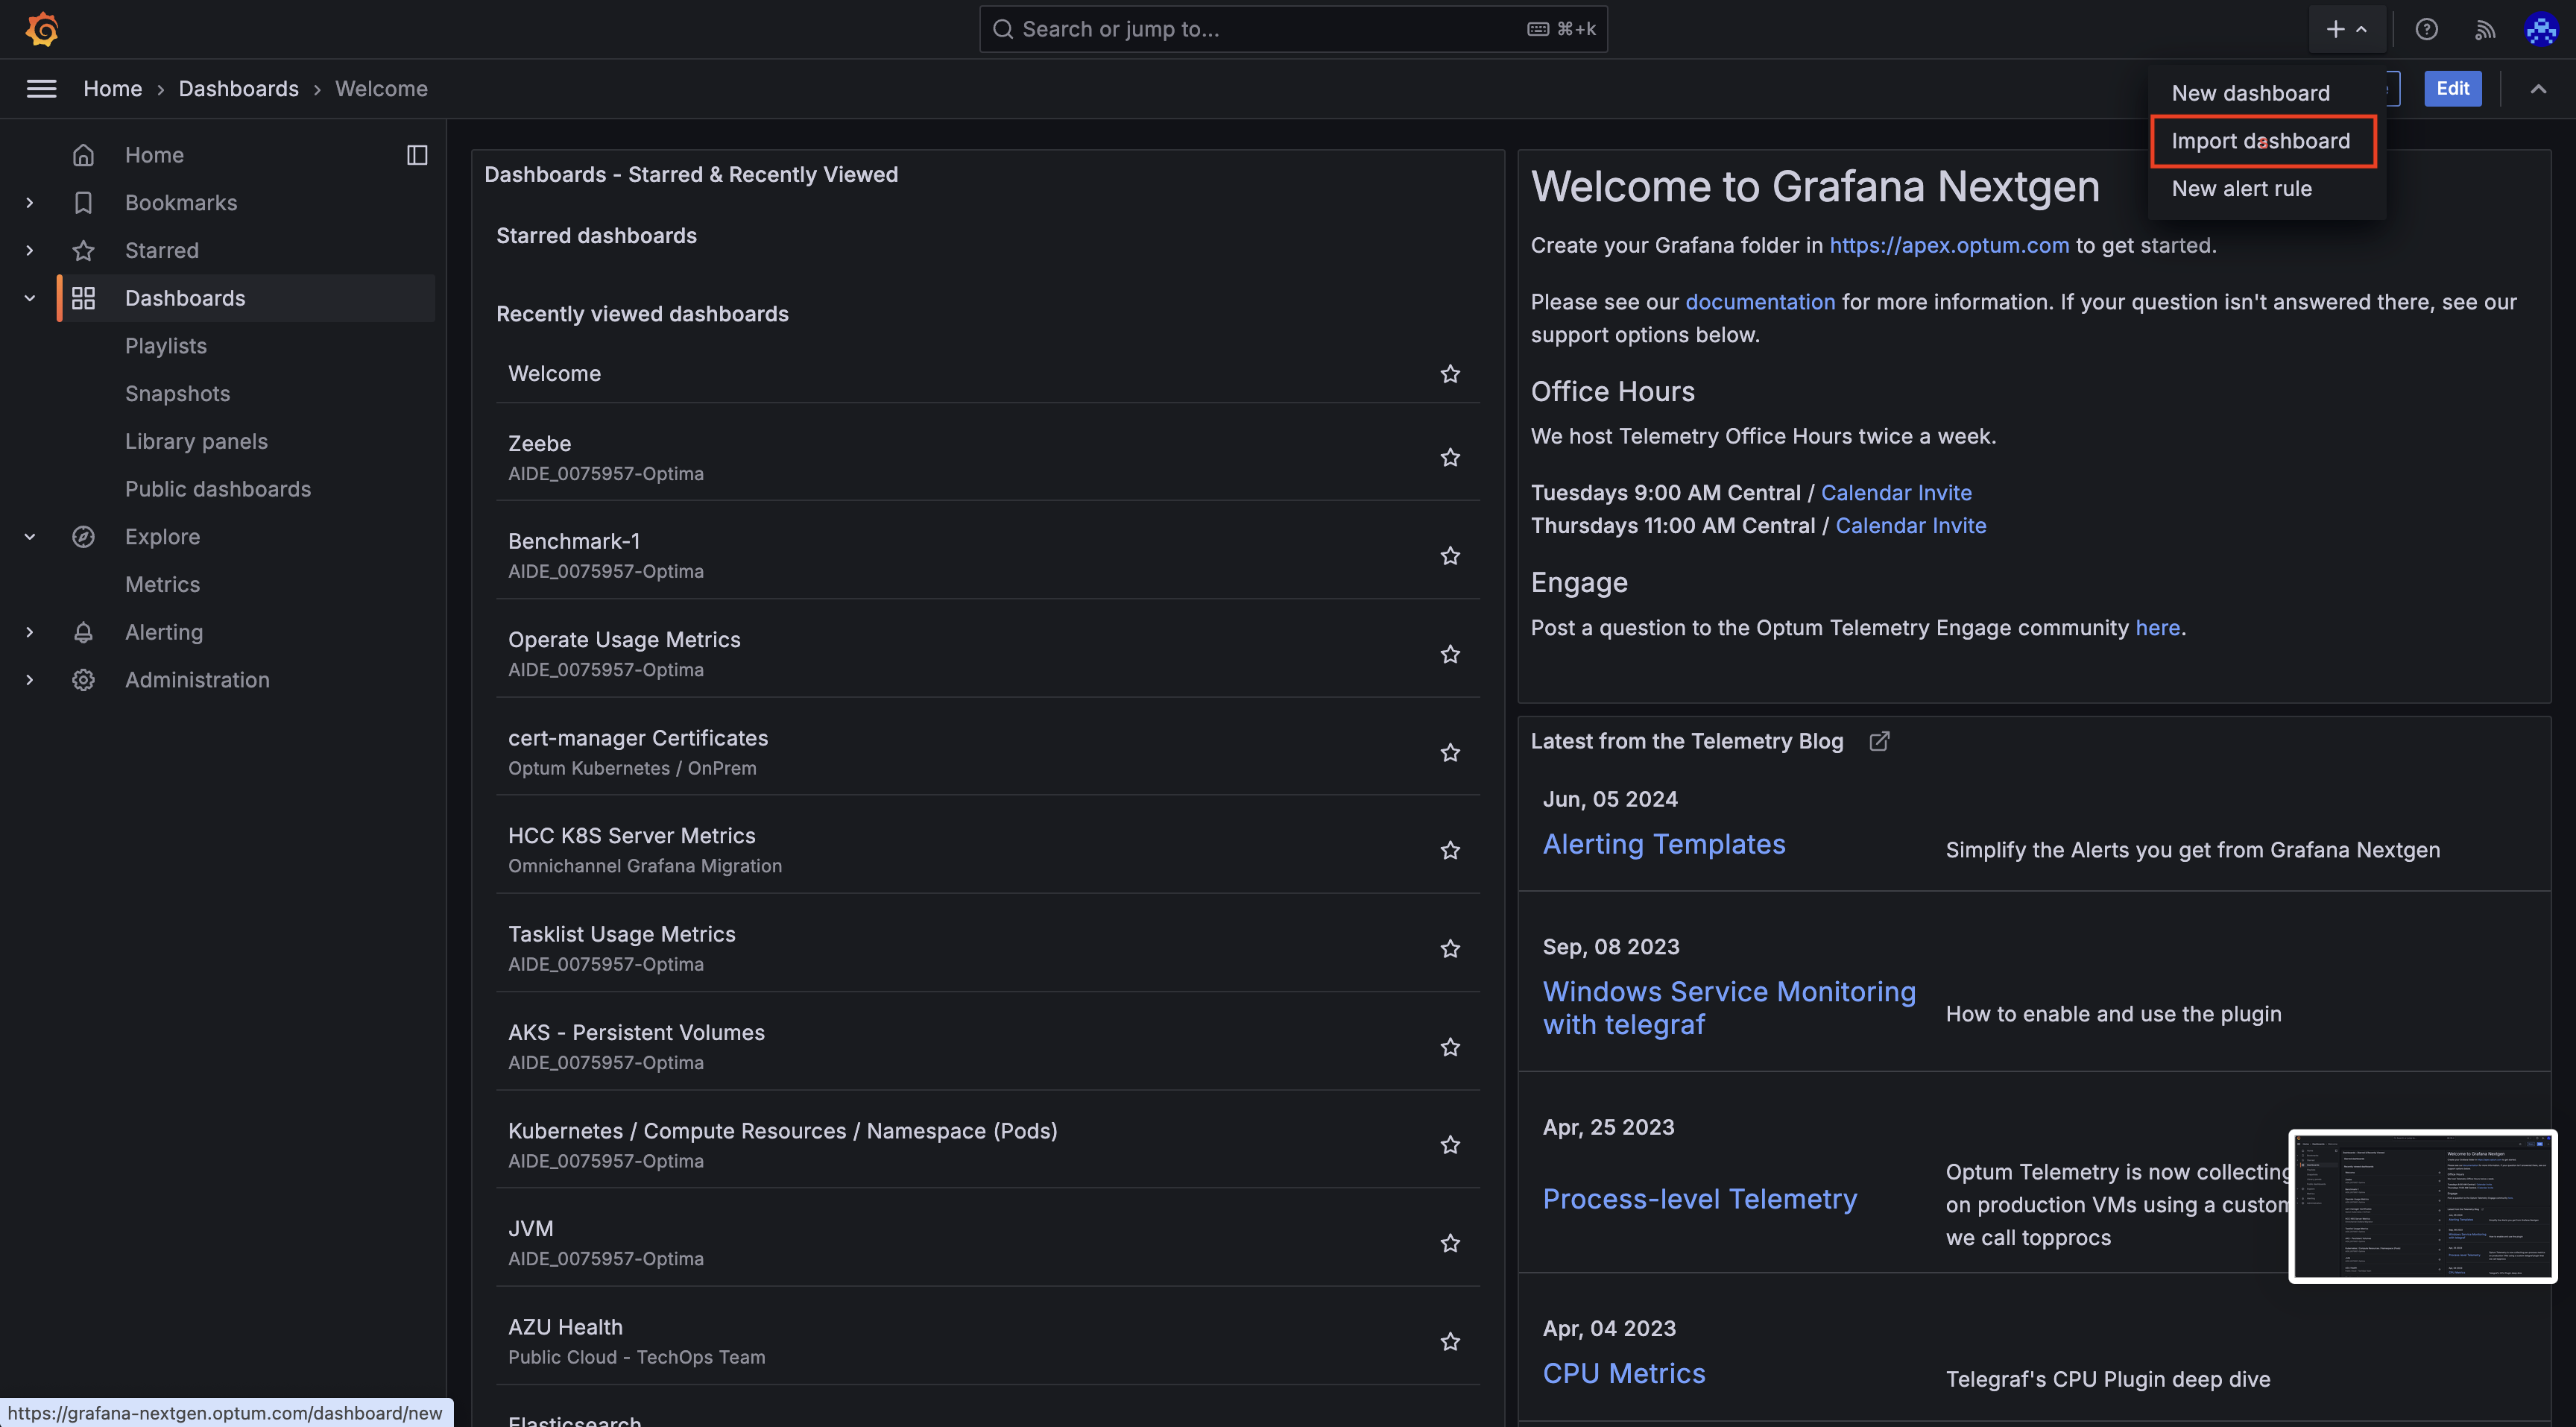
Click on Import Dashboard.
-
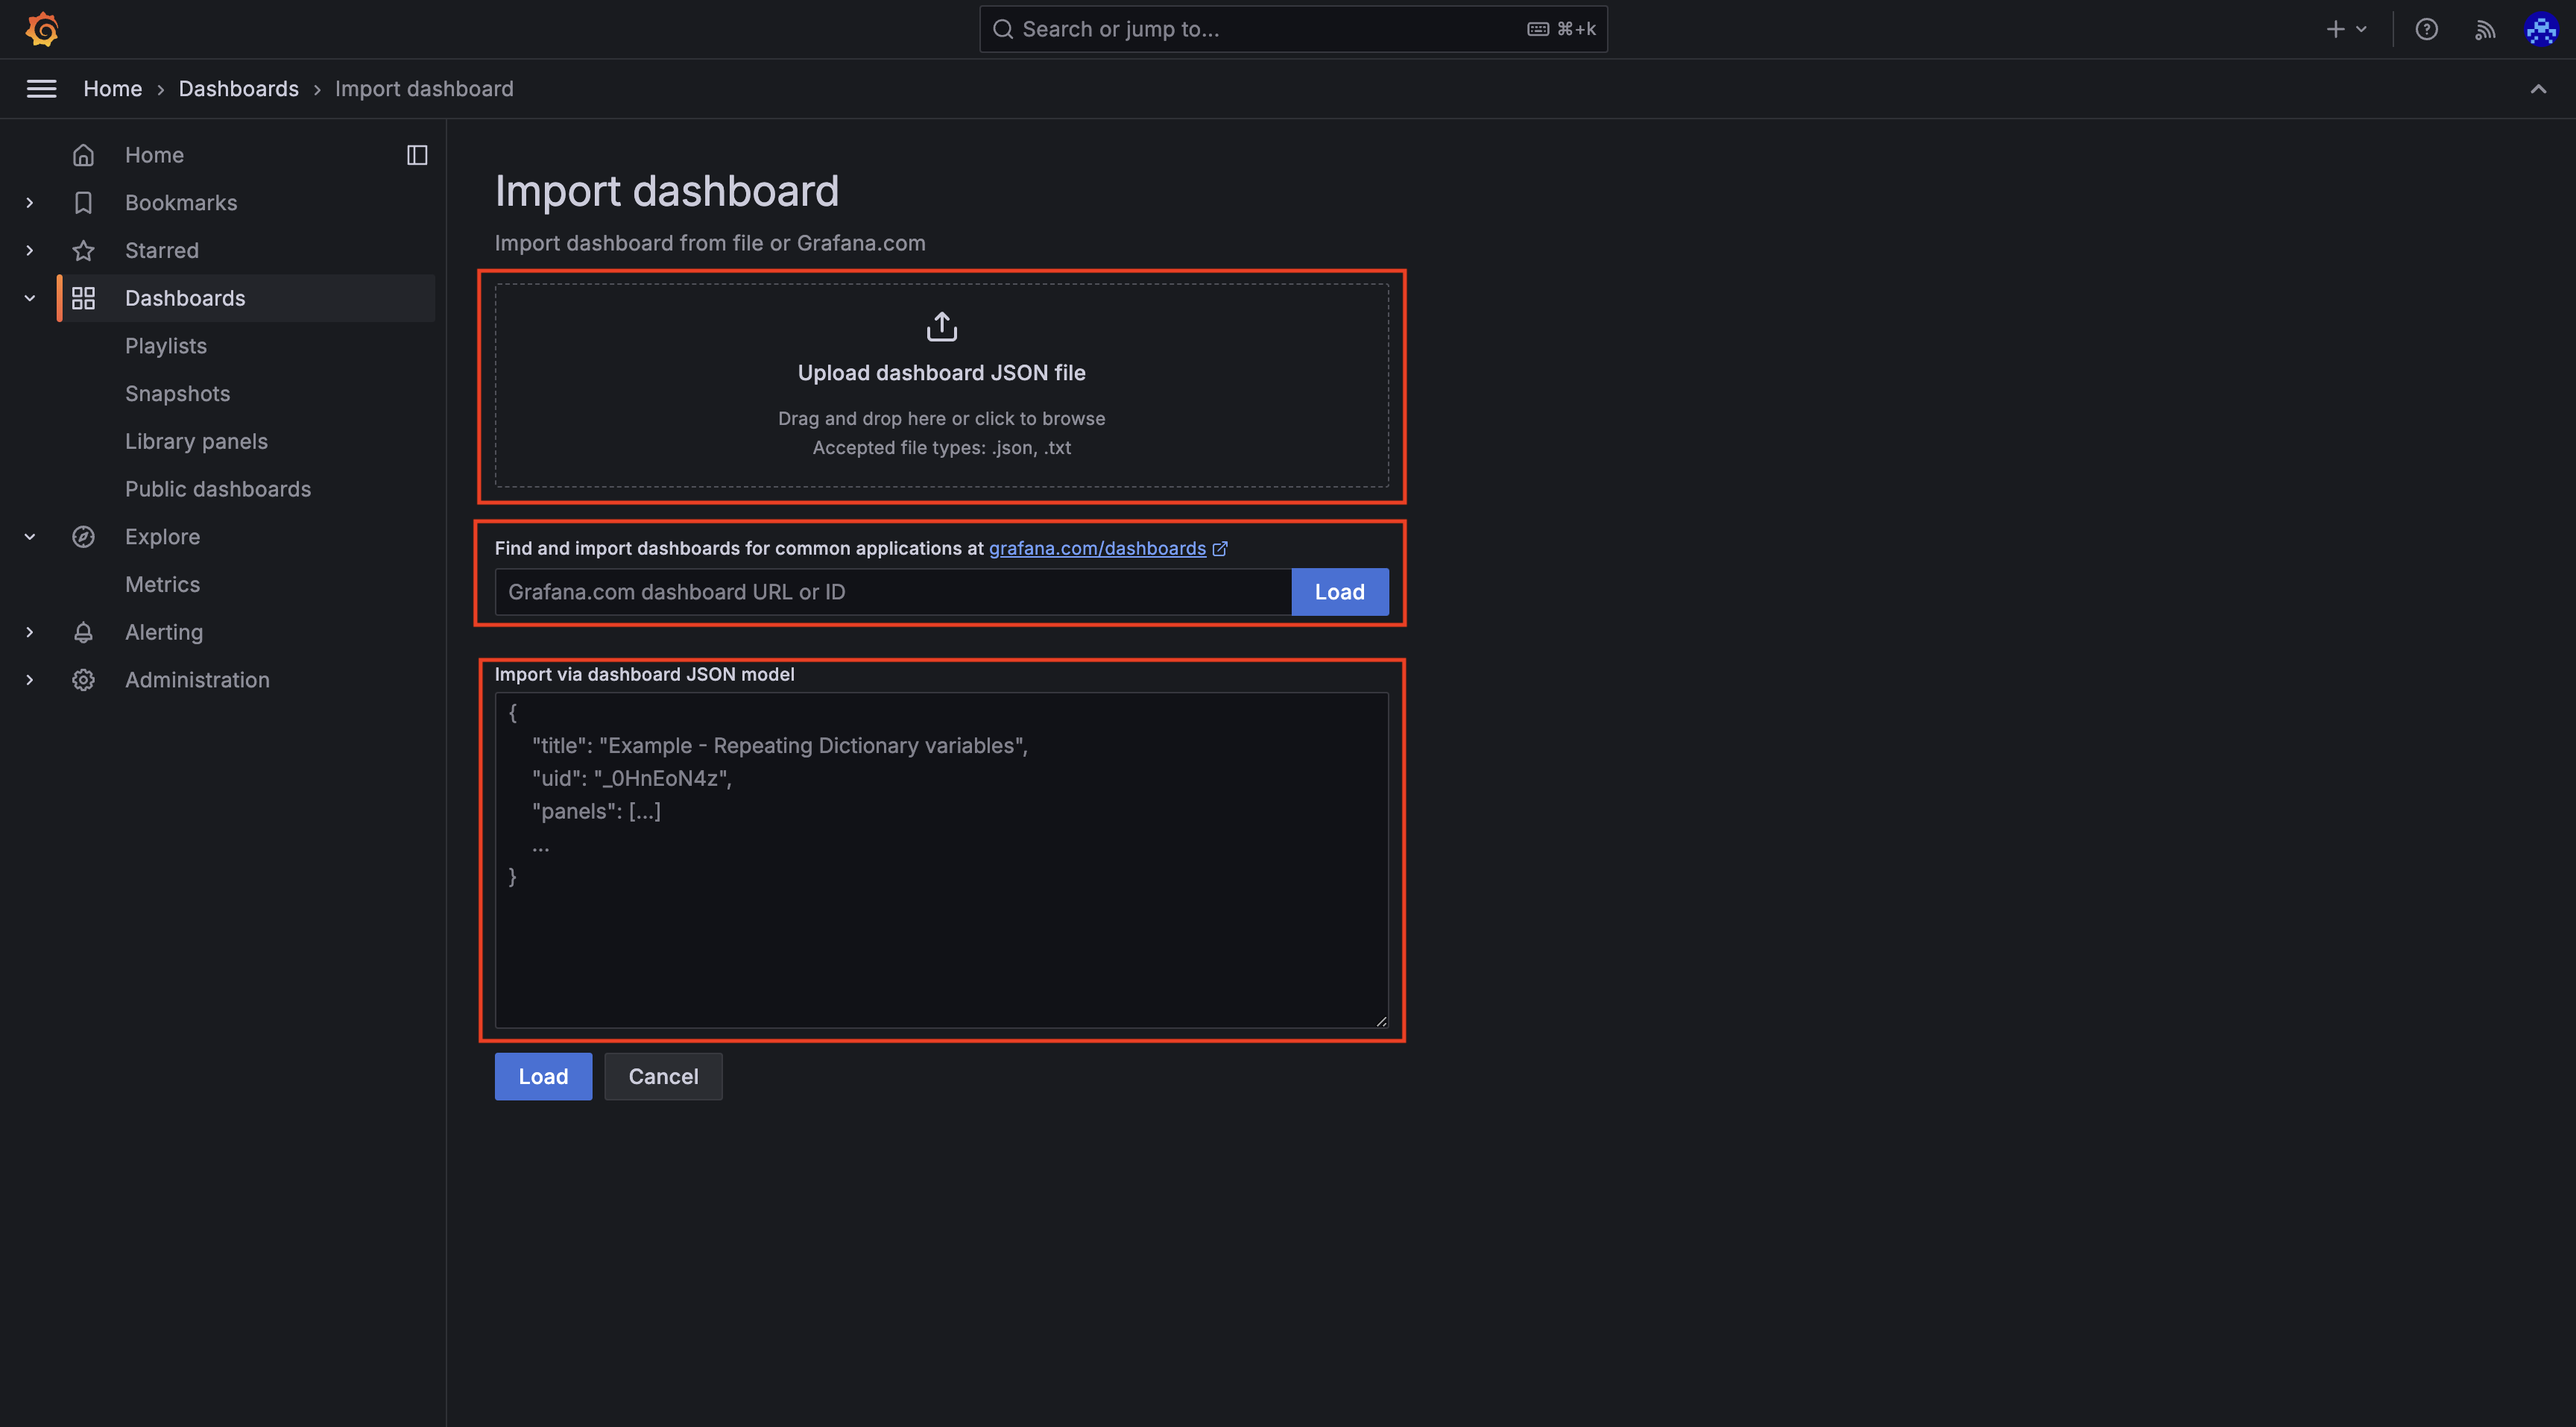
We can either Upload Json from file, Use the Grafana Dashboard ID for duplicating dashboard or directly paste the JSON.
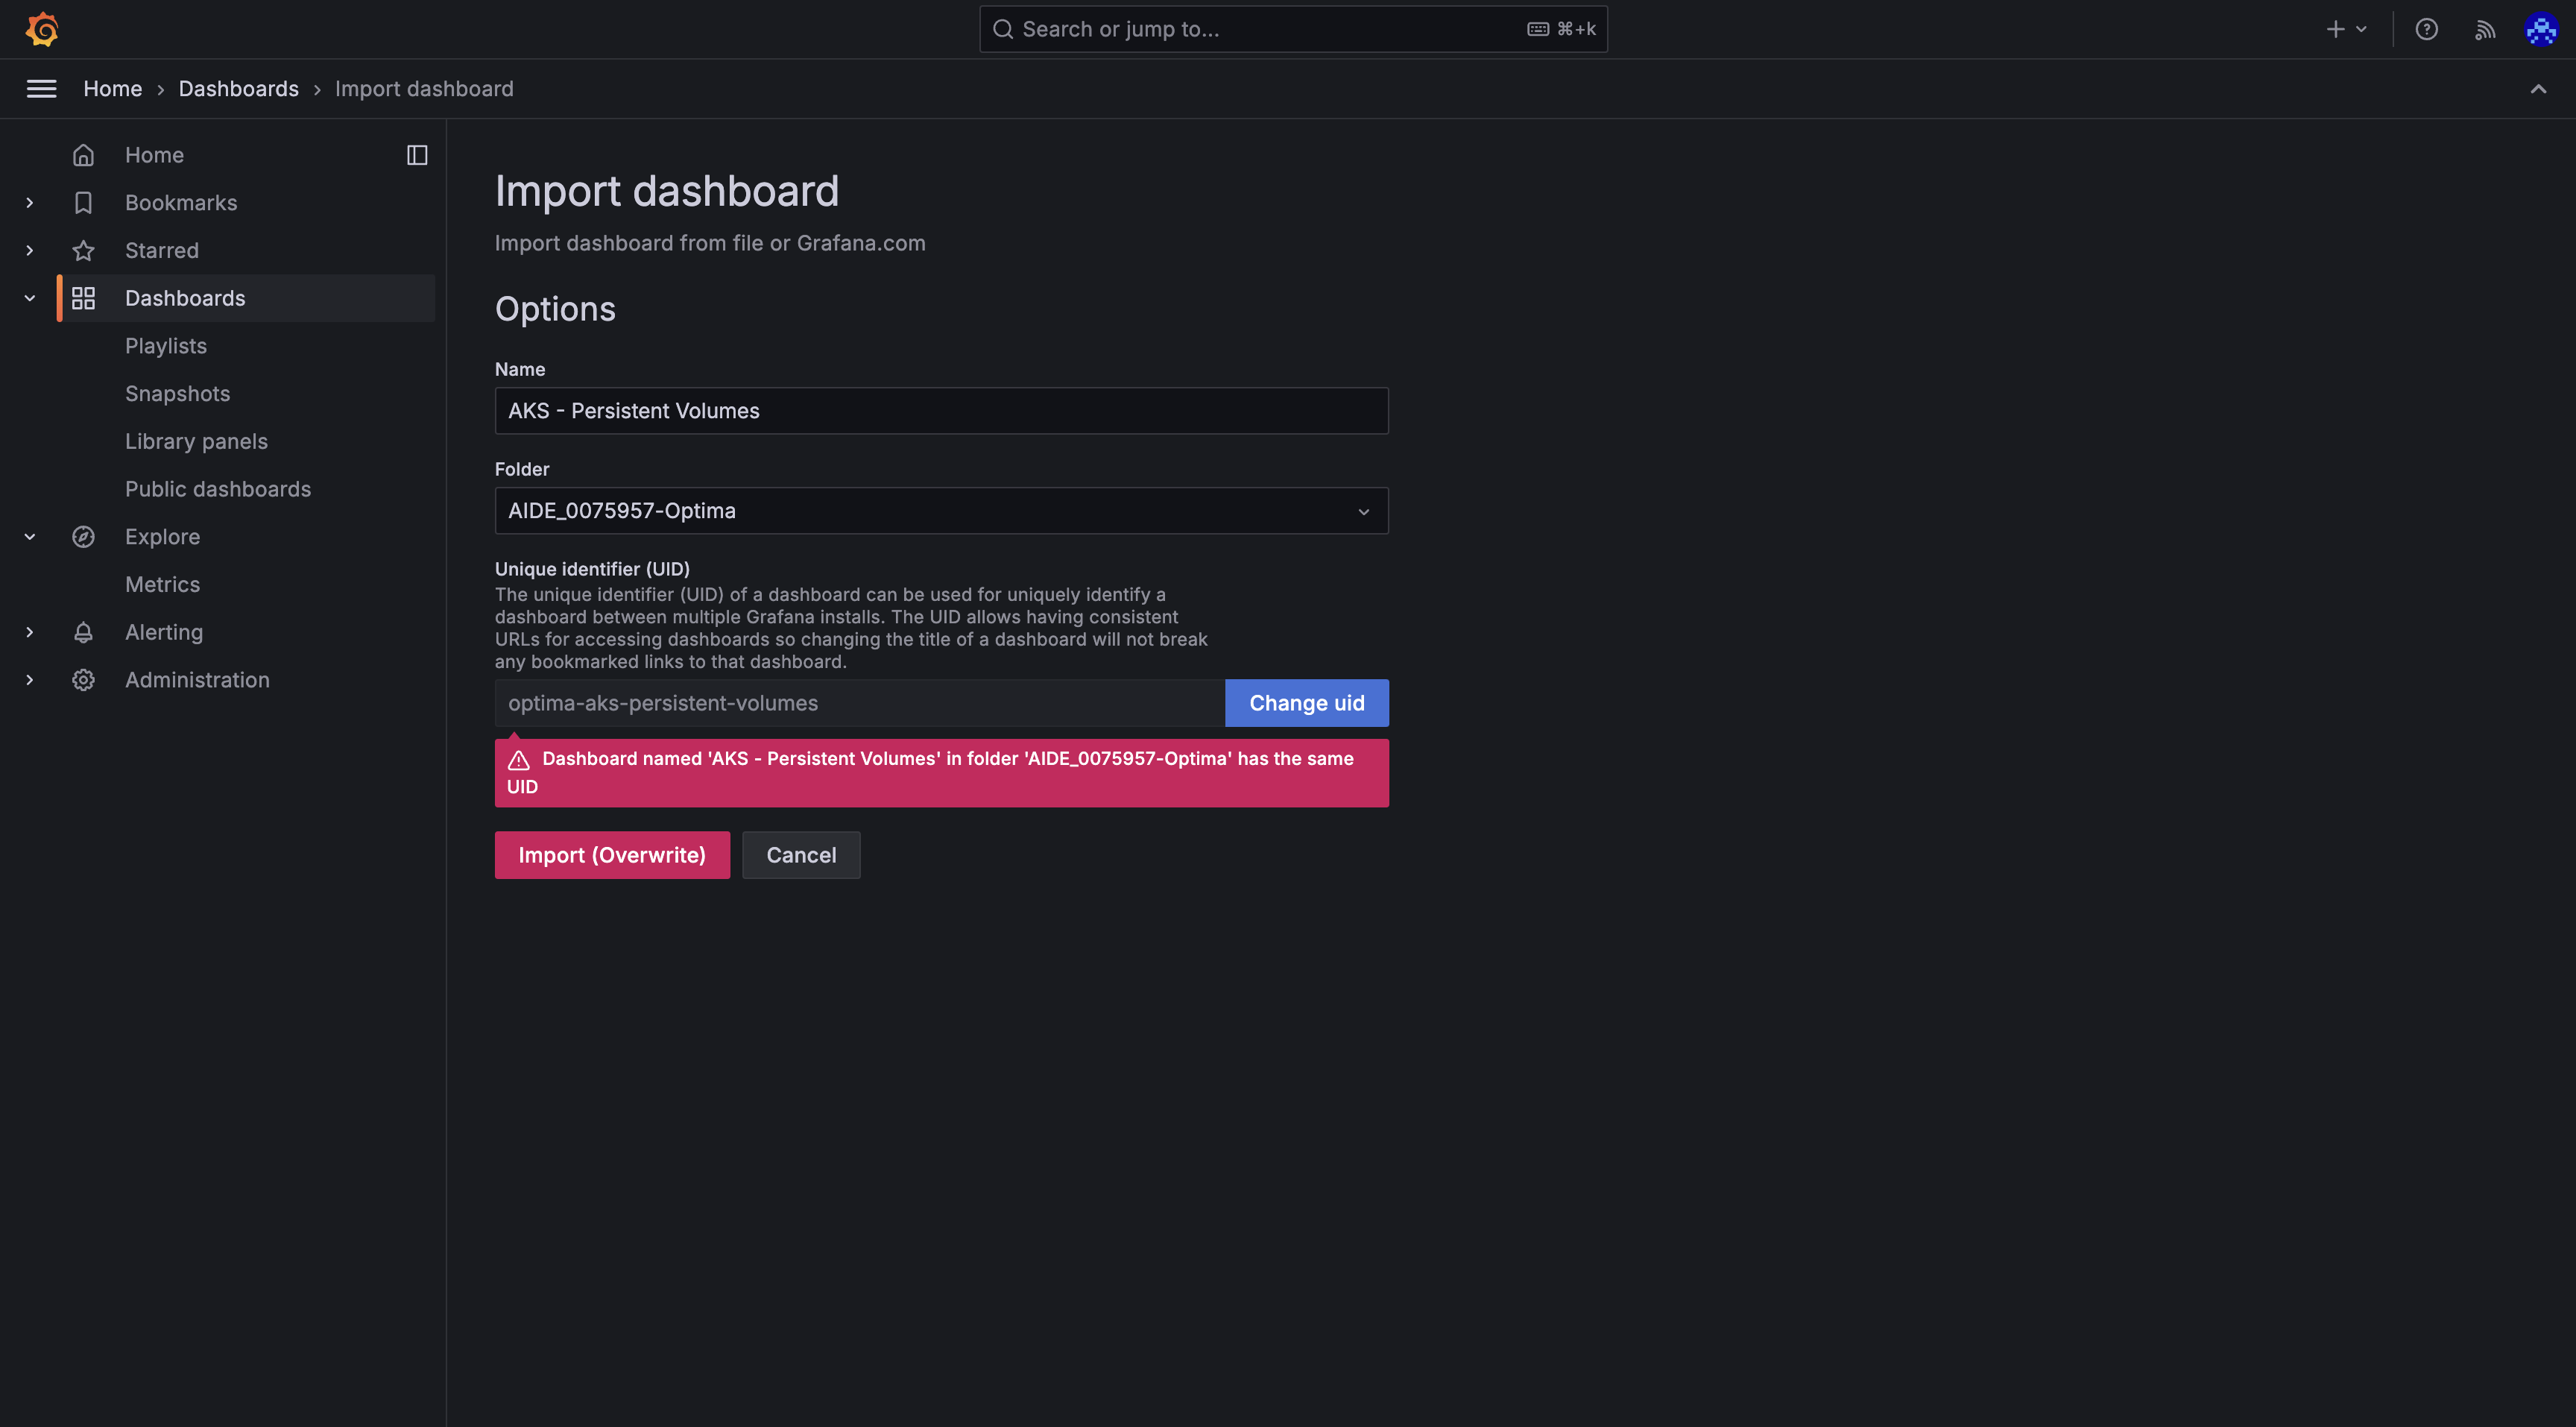
-
After Clicking on the Load Button, Select appropiate Datasource, Name and Folder and import the Dashboard. Change the UID if another dasgboard of same name and id exists.